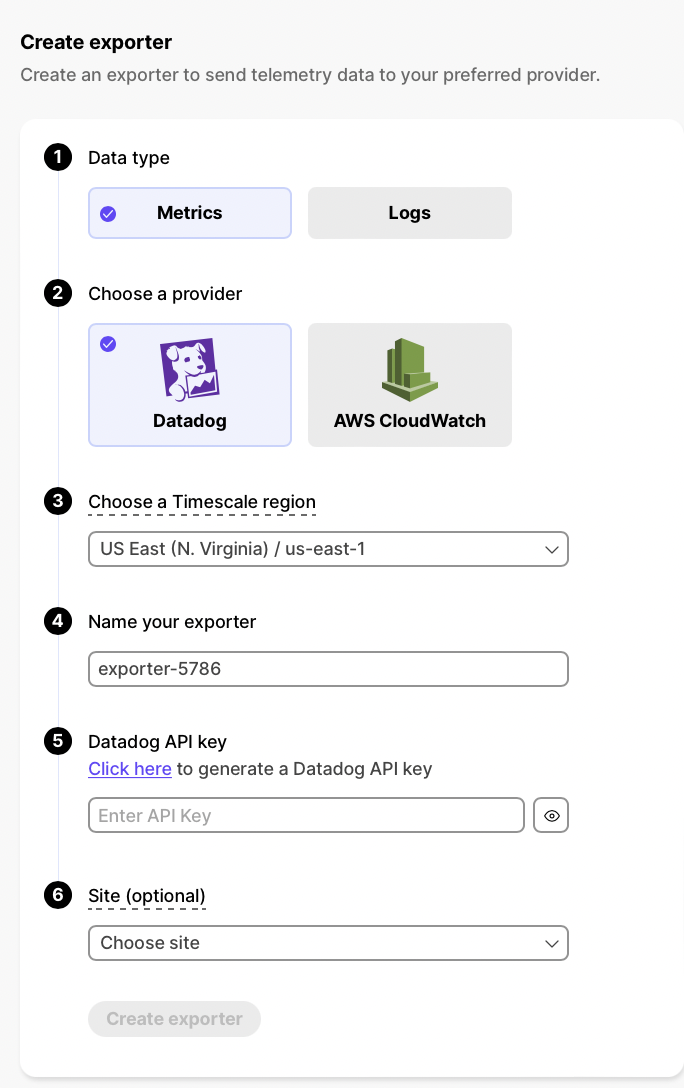
You can export your service telemetry to a third-party monitoring tool, such as Datadog or AWS CloudWatch. Exported metrics include CPU usage, RAM usage, and storage.
Export telemetry data by:
Important
Your exporter must be in the same AWS region as the Timescale Service it is attached to. If you have Timescale Services running in multiple regions, create an exporter for each region.
- In the Timescale console, navigate to
Integrations. - Click
Create exporter. - Choose the telemetry data type that you would like to send to a provider.
- Under
Choose a provider, chooseDatadog. - Choose an AWS region for your exporter to live within Timescale. The exporter is only available to database services in the same AWS region.
- Name your exporter. This name appears in the Cloud console, so choose a descriptive name.
- Add a Datadog API key. If you don't have an API key yet, you can create one by following the instructions in the Datadog documentation.
- Under Site, choose your Datadog region. You can choose a region to meet any regulatory requirements or application needs you might have.
- Click
Create exporter.

Once you create a data exporter, you can attach it to a service. The exporter then exports that service's telemetry data.
You can only have one exporter per service.
Important
Your exporter must be in the same AWS region as the Timescale Service it is attached to. If you have Timescale Services running in multiple regions, create an exporter for each region.
- Navigate to
Services. Click on the service you want to connect to your exporter. - Navigate to
Operations, thenIntegrations. - Select an exporter and click
Attach exporter.
Warning
If you would like to attach a logs exporter to an already existing service, you do not need to restart the service. The service only needs to be restarted when you attach the first logs exporter.
You can now monitor your service metrics from the metrics explorer in Datadog, or query them from the cloudWatch metrics page in AWS Console. For more information, see the Datadog or Cloudwatch documentation.
When you have set up your integration, you can check that it is working correctly by looking for the metrics that Timescale exports. The metric names are:
timescale.cloud.system.cpu.usage.millicorestimescale.cloud.system.cpu.total.millicorestimescale.cloud.system.memory.usage.bytestimescale.cloud.system.memory.total.bytestimescale.cloud.system.disk.usage.bytestimescale.cloud.system.disk.total.bytes
Additionally, Timescale exports tags that you can use to filter your results. You can also check that these tags are being correctly exported:
| Tag | Example variable | Description |
|---|---|---|
host | us-east-1.timescale.cloud | |
project-id | ||
service-id | ||
region | us-east-1 | Timescale region |
role | replica or primary | For services with replicas |
node-id | For multi-node services |
You can edit a data exporter after you create it. Some fields, such as the provider and AWS region, can't be changed.
- Navigate to
Integrations. - Beside the exporter you want to edit, click the menu button. Click
Edit. - Edit the exporter fields and save your changes.
Delete any data exporters that you no longer need.
- Before deleting a data exporter, remove all connected services.
- For each connected service, navigate to the service
Operationstab. - Click
Integrations. - Click the trash can icon to remove the exporter from the service. This doesn't delete the exporter itself.
- In the main menu, navigate to
Integrations. - Beside the exporter you want to delete, click the menu button. Click
Delete. - Confirm that you want to delete.
Keywords
Found an issue on this page?Report an issue or Edit this page in GitHub.