Grafana is organized into Dashboards and Panels. A dashboard represents a
view into the performance of a system, and each dashboard consists of one or
more panels, which represents information about a specific metric related to
that system.
Start by creating a new dashboard.
Hover your mouse over the
+icon in the far left of the Grafana user interface to bring up aCreatemenu. SelectDashboard. When you new dashboard is created, you'll see aNew Panelscreen, with options forAdd QueryandChoose Visualization. In the future, if you already have a dashboard with panels, you can click the+icon at the top of the Grafana user interface to add a panel to an existing dashboard.Click
Choose Visualizationto add a new panel. There are several options for different Grafana visualizations. This example uses theGraphvisualization.There are multiple ways to configure the panel, but you can accept all the defaults to create a simple
Linesgraph.In the far left section of the Grafana user interface, navigate to the
Queriestab.Set the query database to the dataset you are using.
You can edit the query directly, or use the built-in query editor.

Note
If you are visualizing time series data in Grafana, make sure you select
Time seriesfrom theFormat Asdrop down in the query builder.
Grafana time-series panels include a tool that lets you filter on a given time
range, called a time filter. Grafana allows you to link the user interface
construct in a Grafana panel with the query itself using the $__timefilter()
function.
This example of a modified query uses the $__timefilter() function to set
the pickup_datetime column as the filtering range for your visualizations:
SELECT--1--time_bucket('1 day', pickup_datetime) AS "time",--2--COUNT(*)FROM ridesWHERE $__timeFilter(pickup_datetime)
You can group your visualizations by the time buckets you've selected,
and order the results by the time buckets as well. So, the GROUP BY and
ORDER BY statements reference time.
For example:
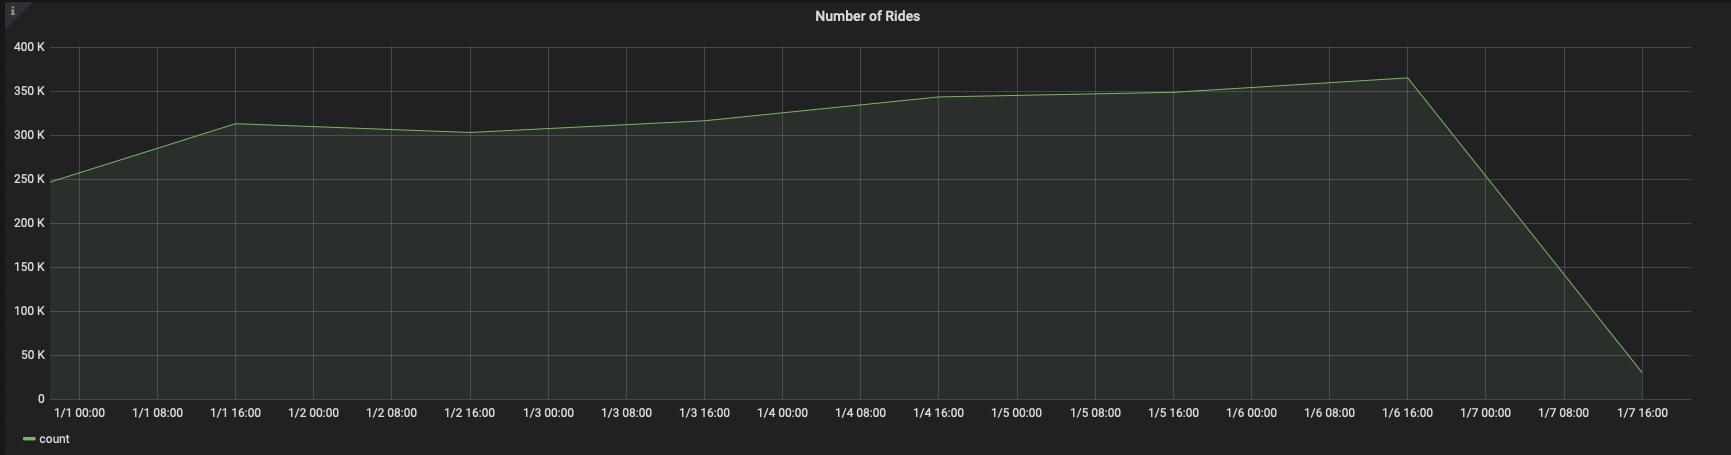
SELECT--1--time_bucket('1 day', pickup_datetime) AS time,--2--COUNT(*)FROM ridesWHERE $__timeFilter(pickup_datetime)GROUP BY timeORDER BY time
When you visualize this query in Grafana, you see this:
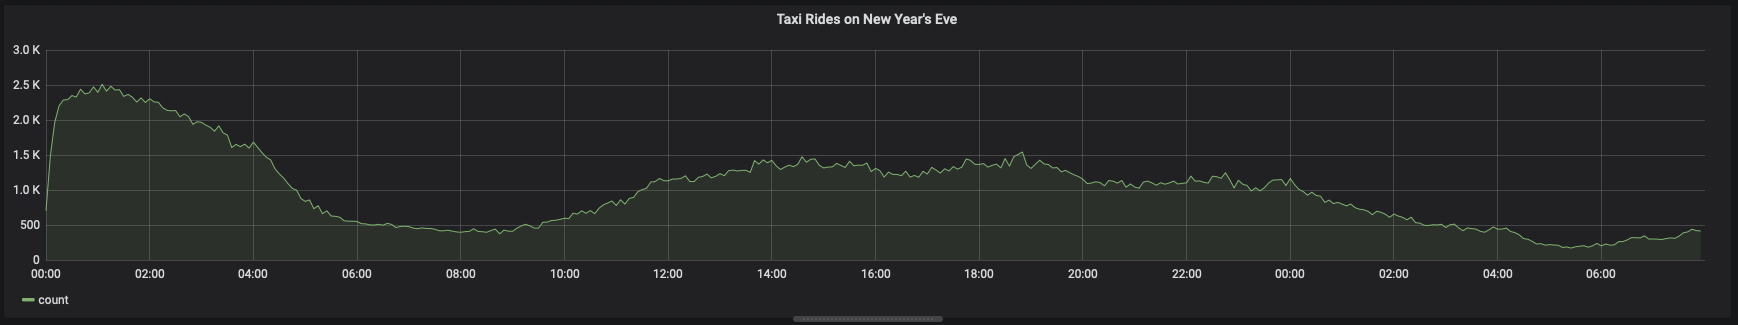
You can adjust the time_bucket function and compare the graphs, like this:
SELECT--1--time_bucket('5m', pickup_datetime) AS time,--2--COUNT(*)FROM ridesWHERE $__timeFilter(pickup_datetime)GROUP BY timeORDER BY time
When you visualize this query, it looks like this:
Keywords
Found an issue on this page?Report an issue or Edit this page in GitHub.