Timescale Cloud: Performance, Scale, Enterprise
Self-hosted products
MST
Timescale Console offers you a quick, convenient way to see how your services are performing, and see how to make them run more efficiently. This includes:
- Recommendations: tips to ensure your service is set up to achieve the best performance.
- Jobs: a list of all the jobs scheduled for your service and their status.
- Connections: a list of all current connections to your service. You can terminate any process in the list.
- Metrics: CPU, memory, and storage usage over time.
- Logs: your service logs with filtering and timeframe selection.
- Insights: an in-depth look into your query performance.
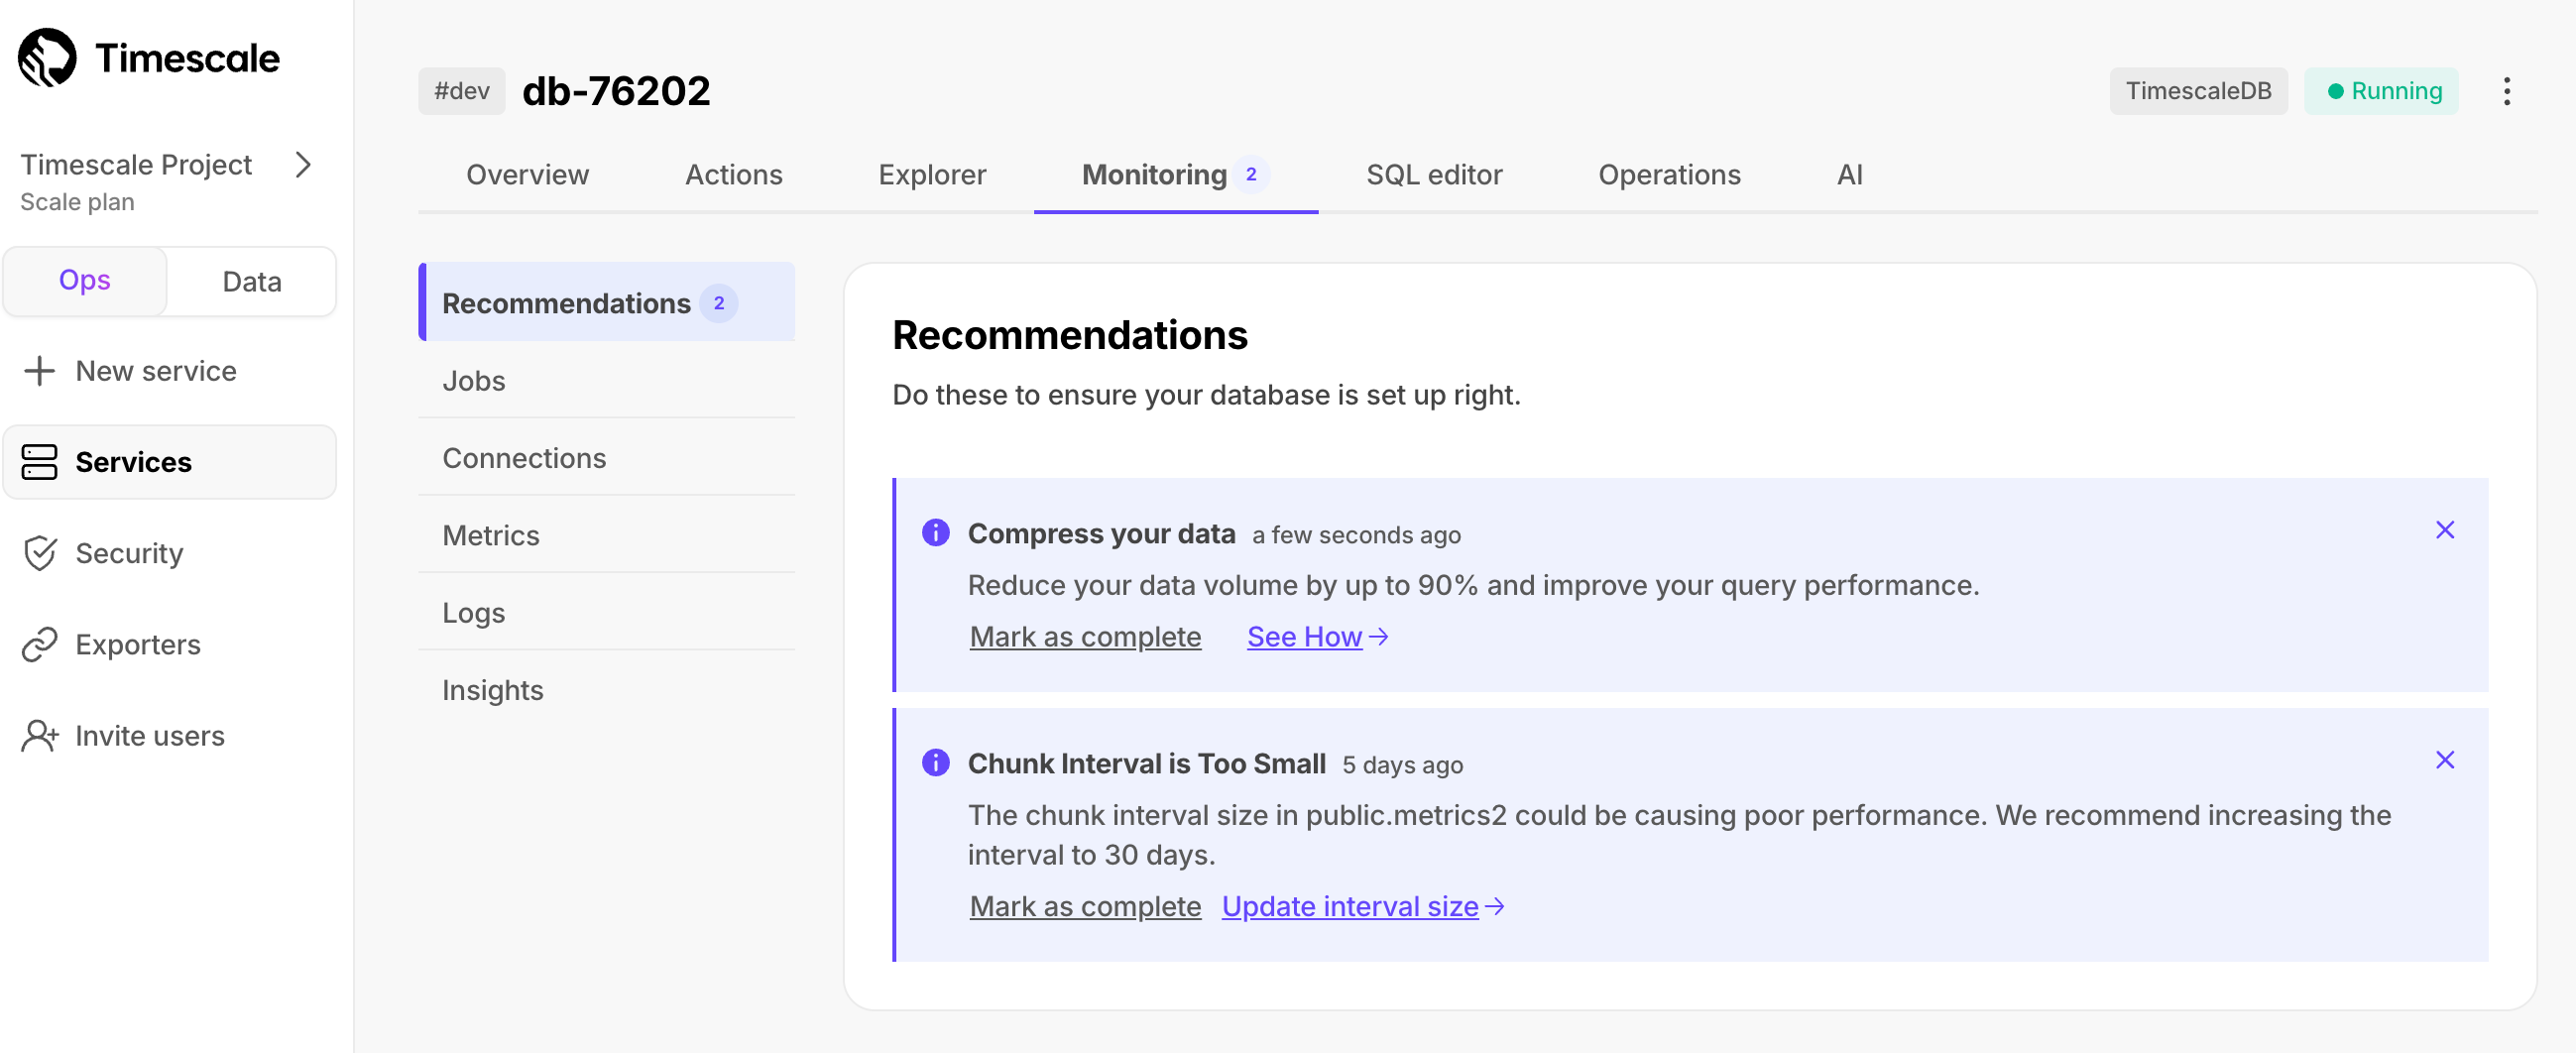
Timescale Cloud offers specific tips on configuring your service. This includes a wide range of actions—from finishing account setup to tuning your service for the best performance. For example, Timescale Cloud may recommend a more suitable chunk interval or draw your attention to consistently failing jobs.
To view recommendations, select your service in Timescale Console, then click Monitoring > Recommendations:
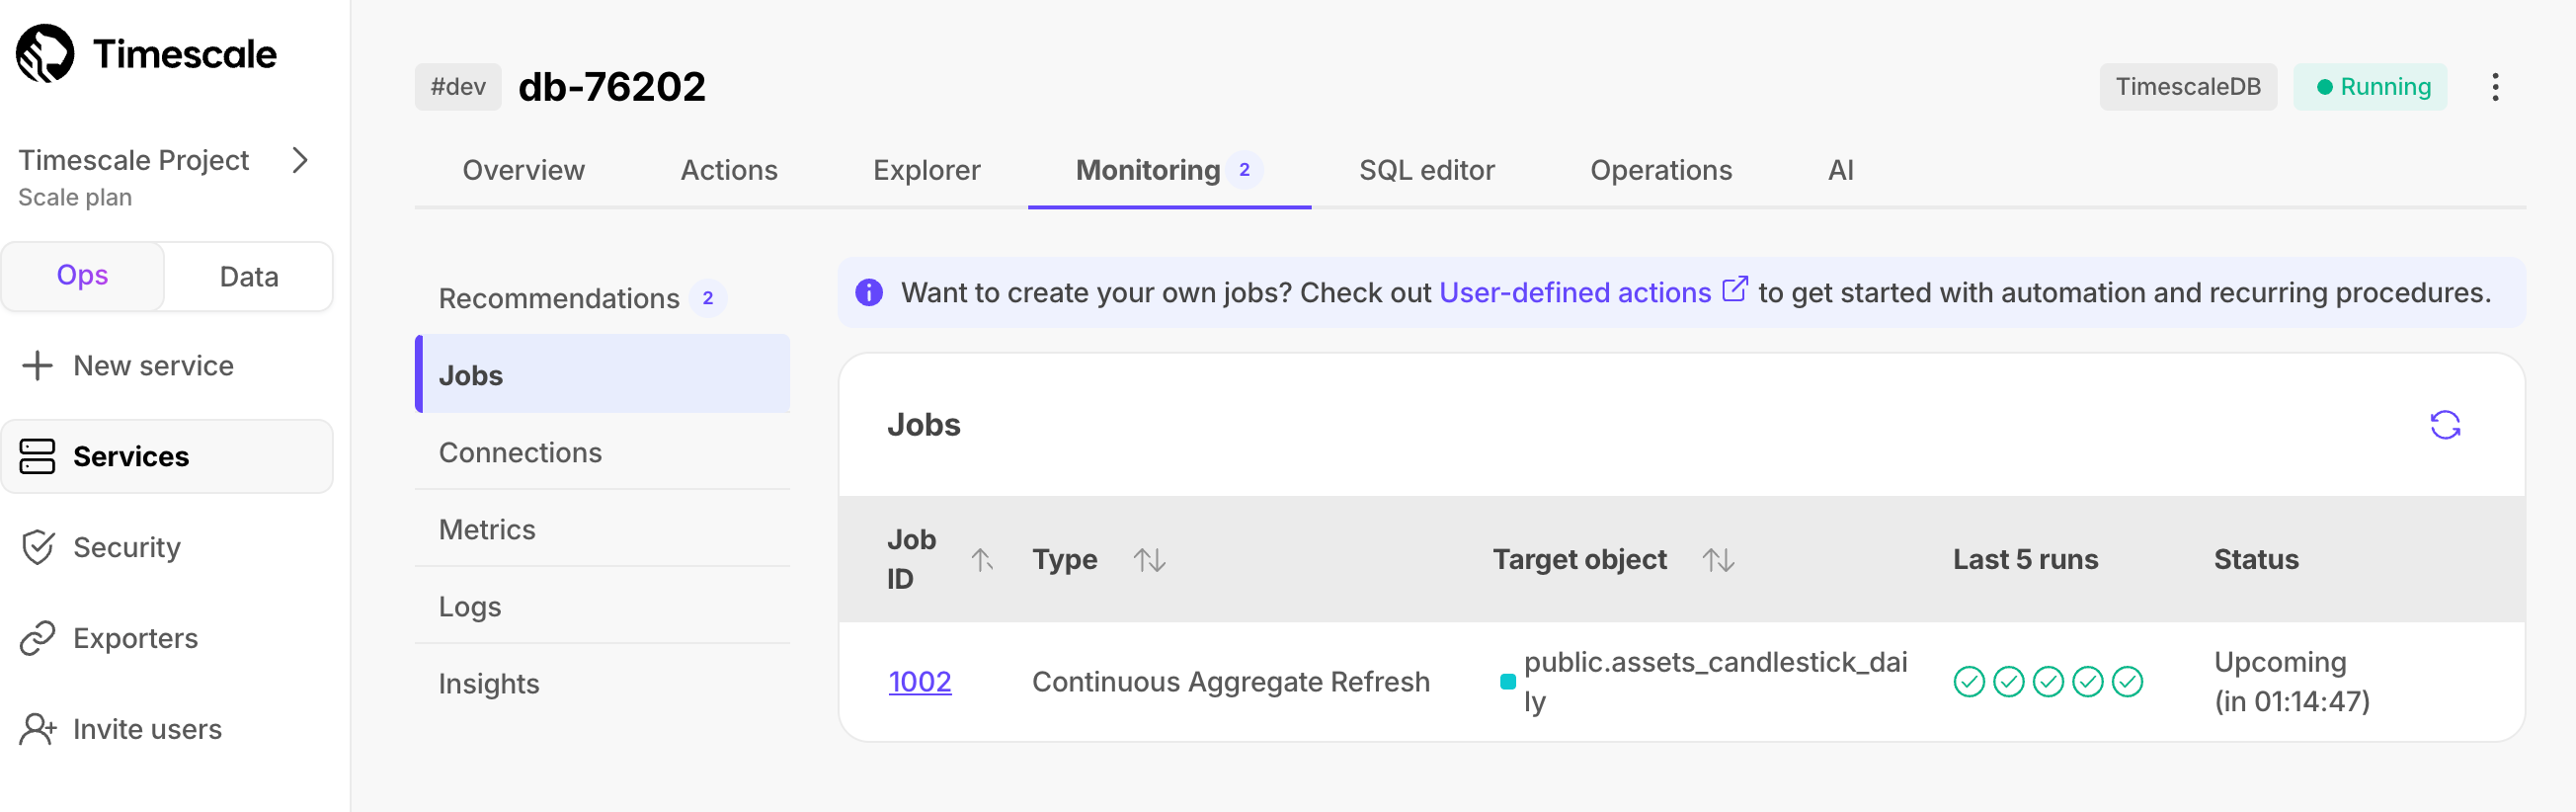
Timescale Cloud summarizes all jobs set up for your service along with their details like type, target object, and status. This includes native Timescale Cloud jobs as well as custom jobs you configure based on your specific needs.
To view jobs, select your service in Timescale Console, then click Monitoring > Jobs:
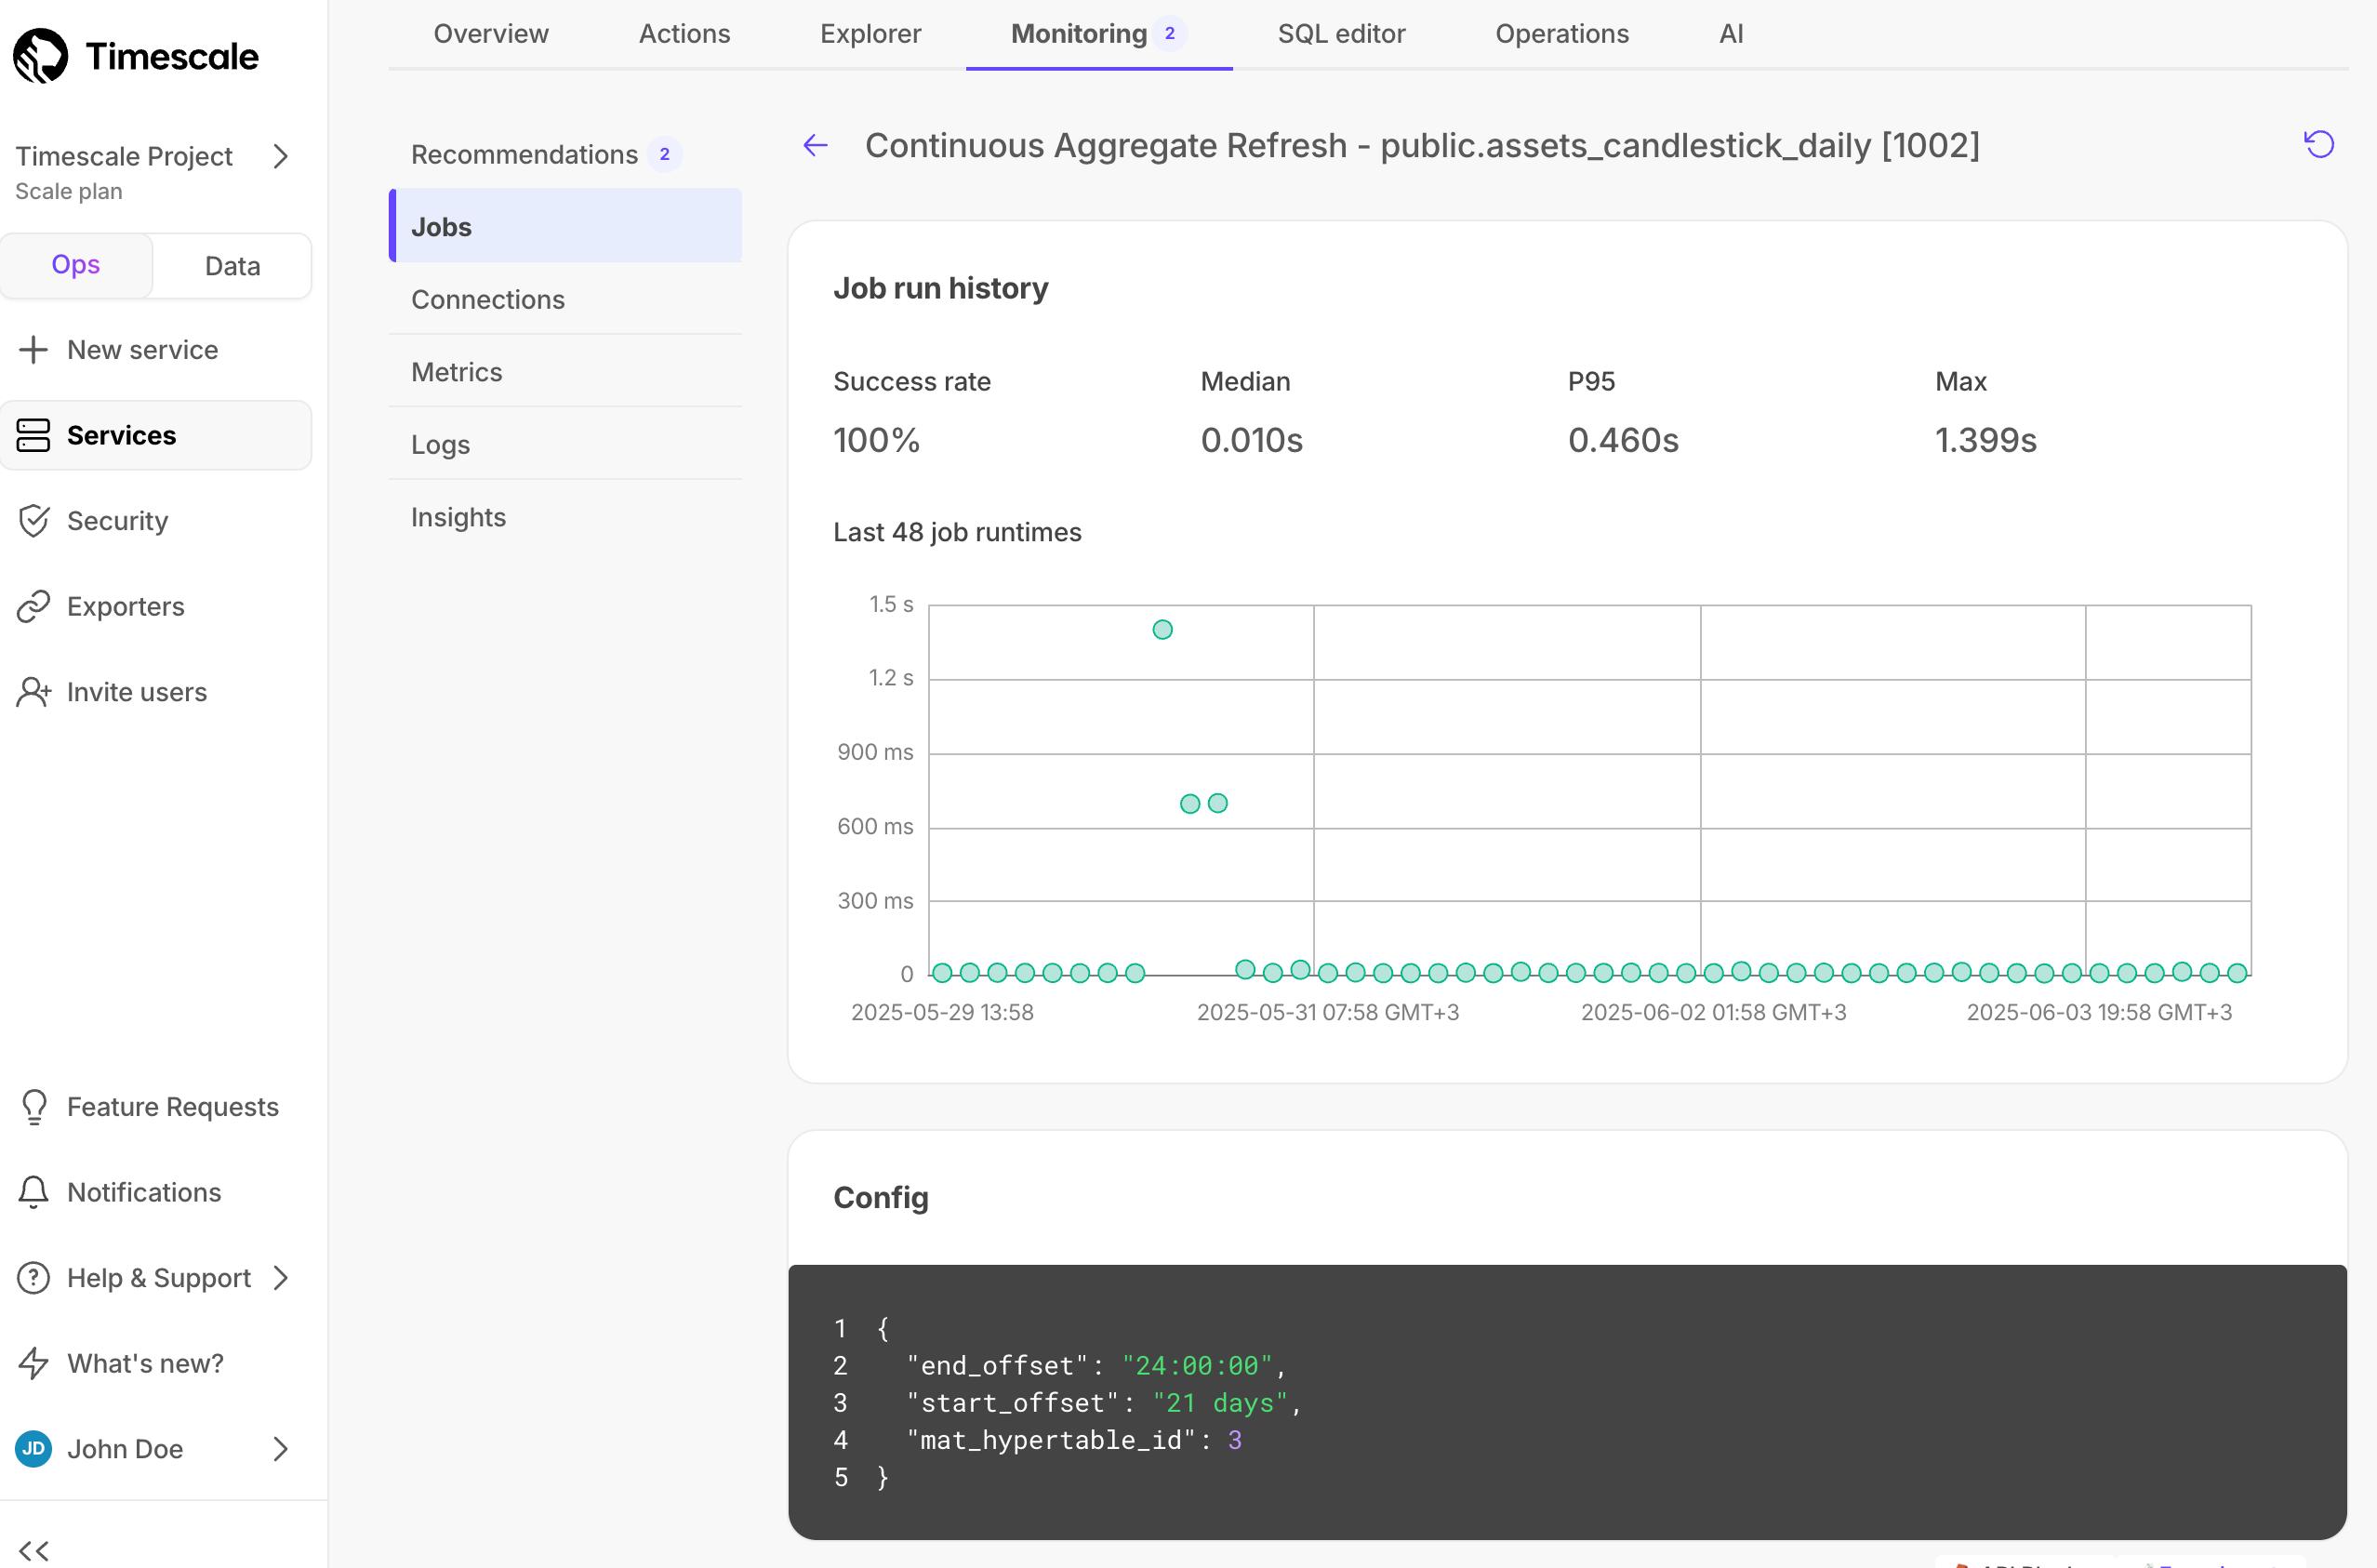
Click on a job ID in the list to view its config and run history:
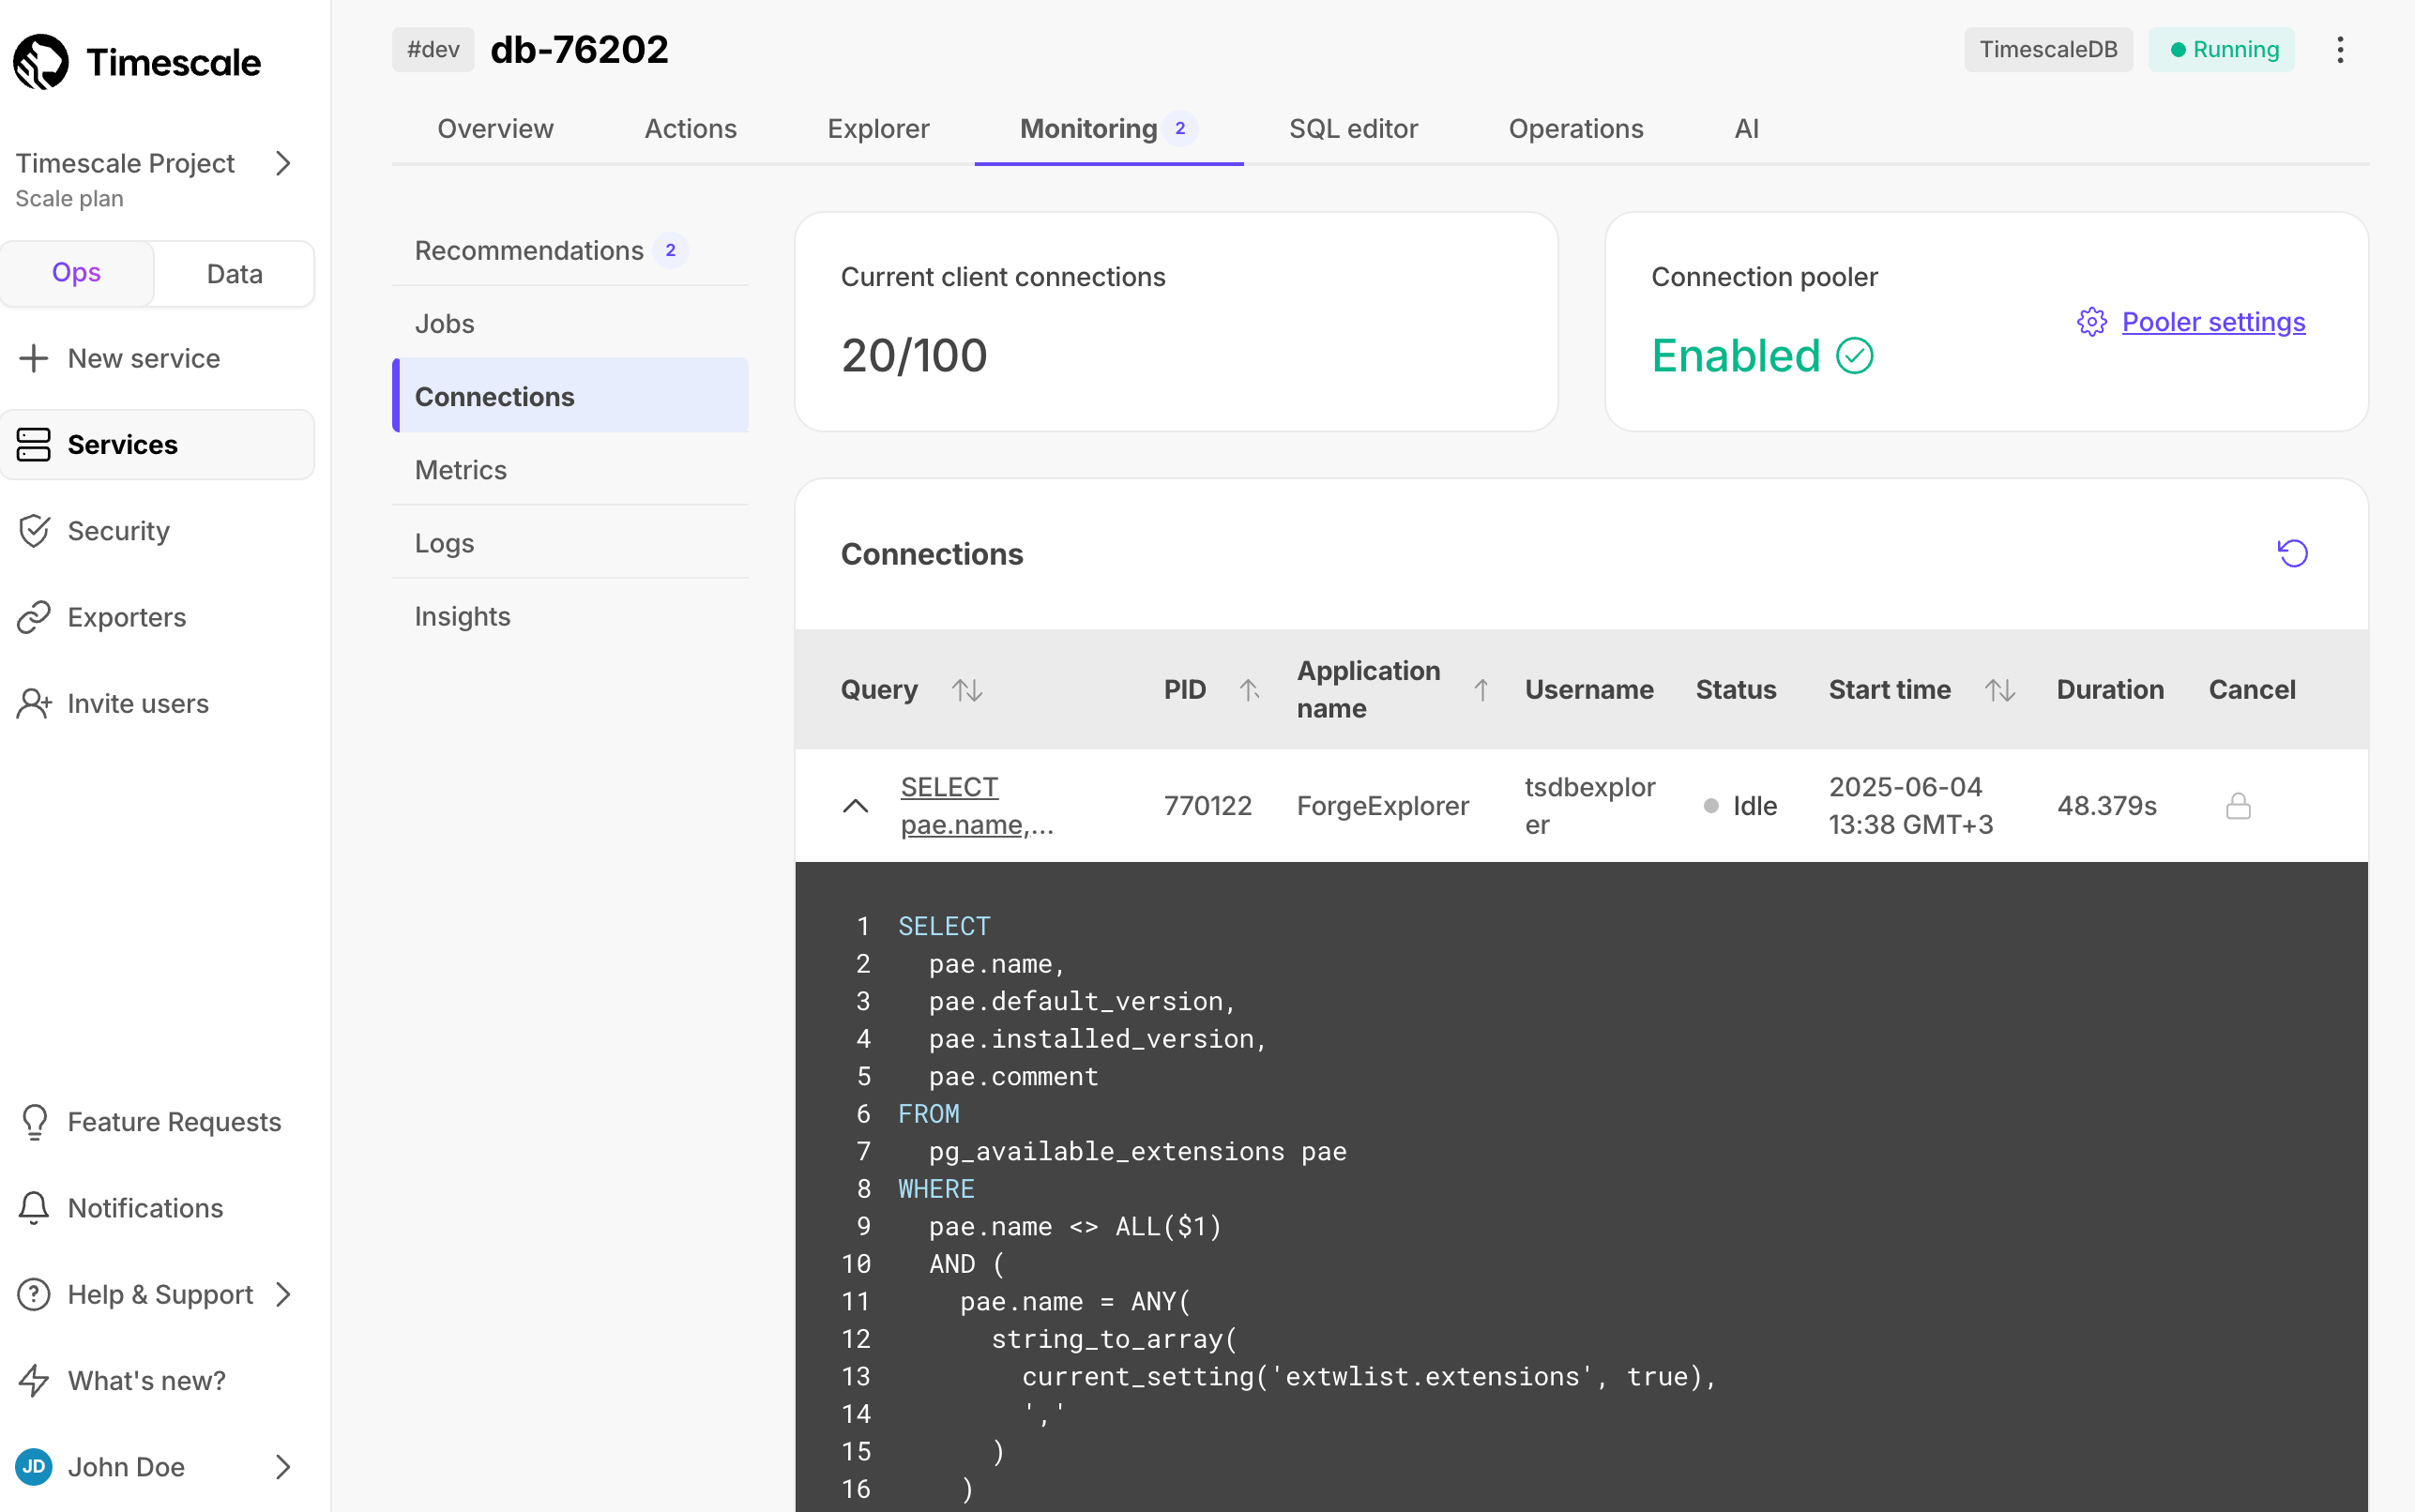
Timescale Cloud lists current connections to your service. This includes details like the corresponding query, connecting application, connection status, start time, and duration.
To view connections, select your service in Timescale Console, then click Monitoring > Connections. Click on a query name in the list to see the SQL:
Timescale Cloud shows you CPU, memory, and storage metrics for up to 30 previous days and with down to 10-second granularity.
To access metrics, select your service in Timescale Console, then click Monitoring > Metrics:
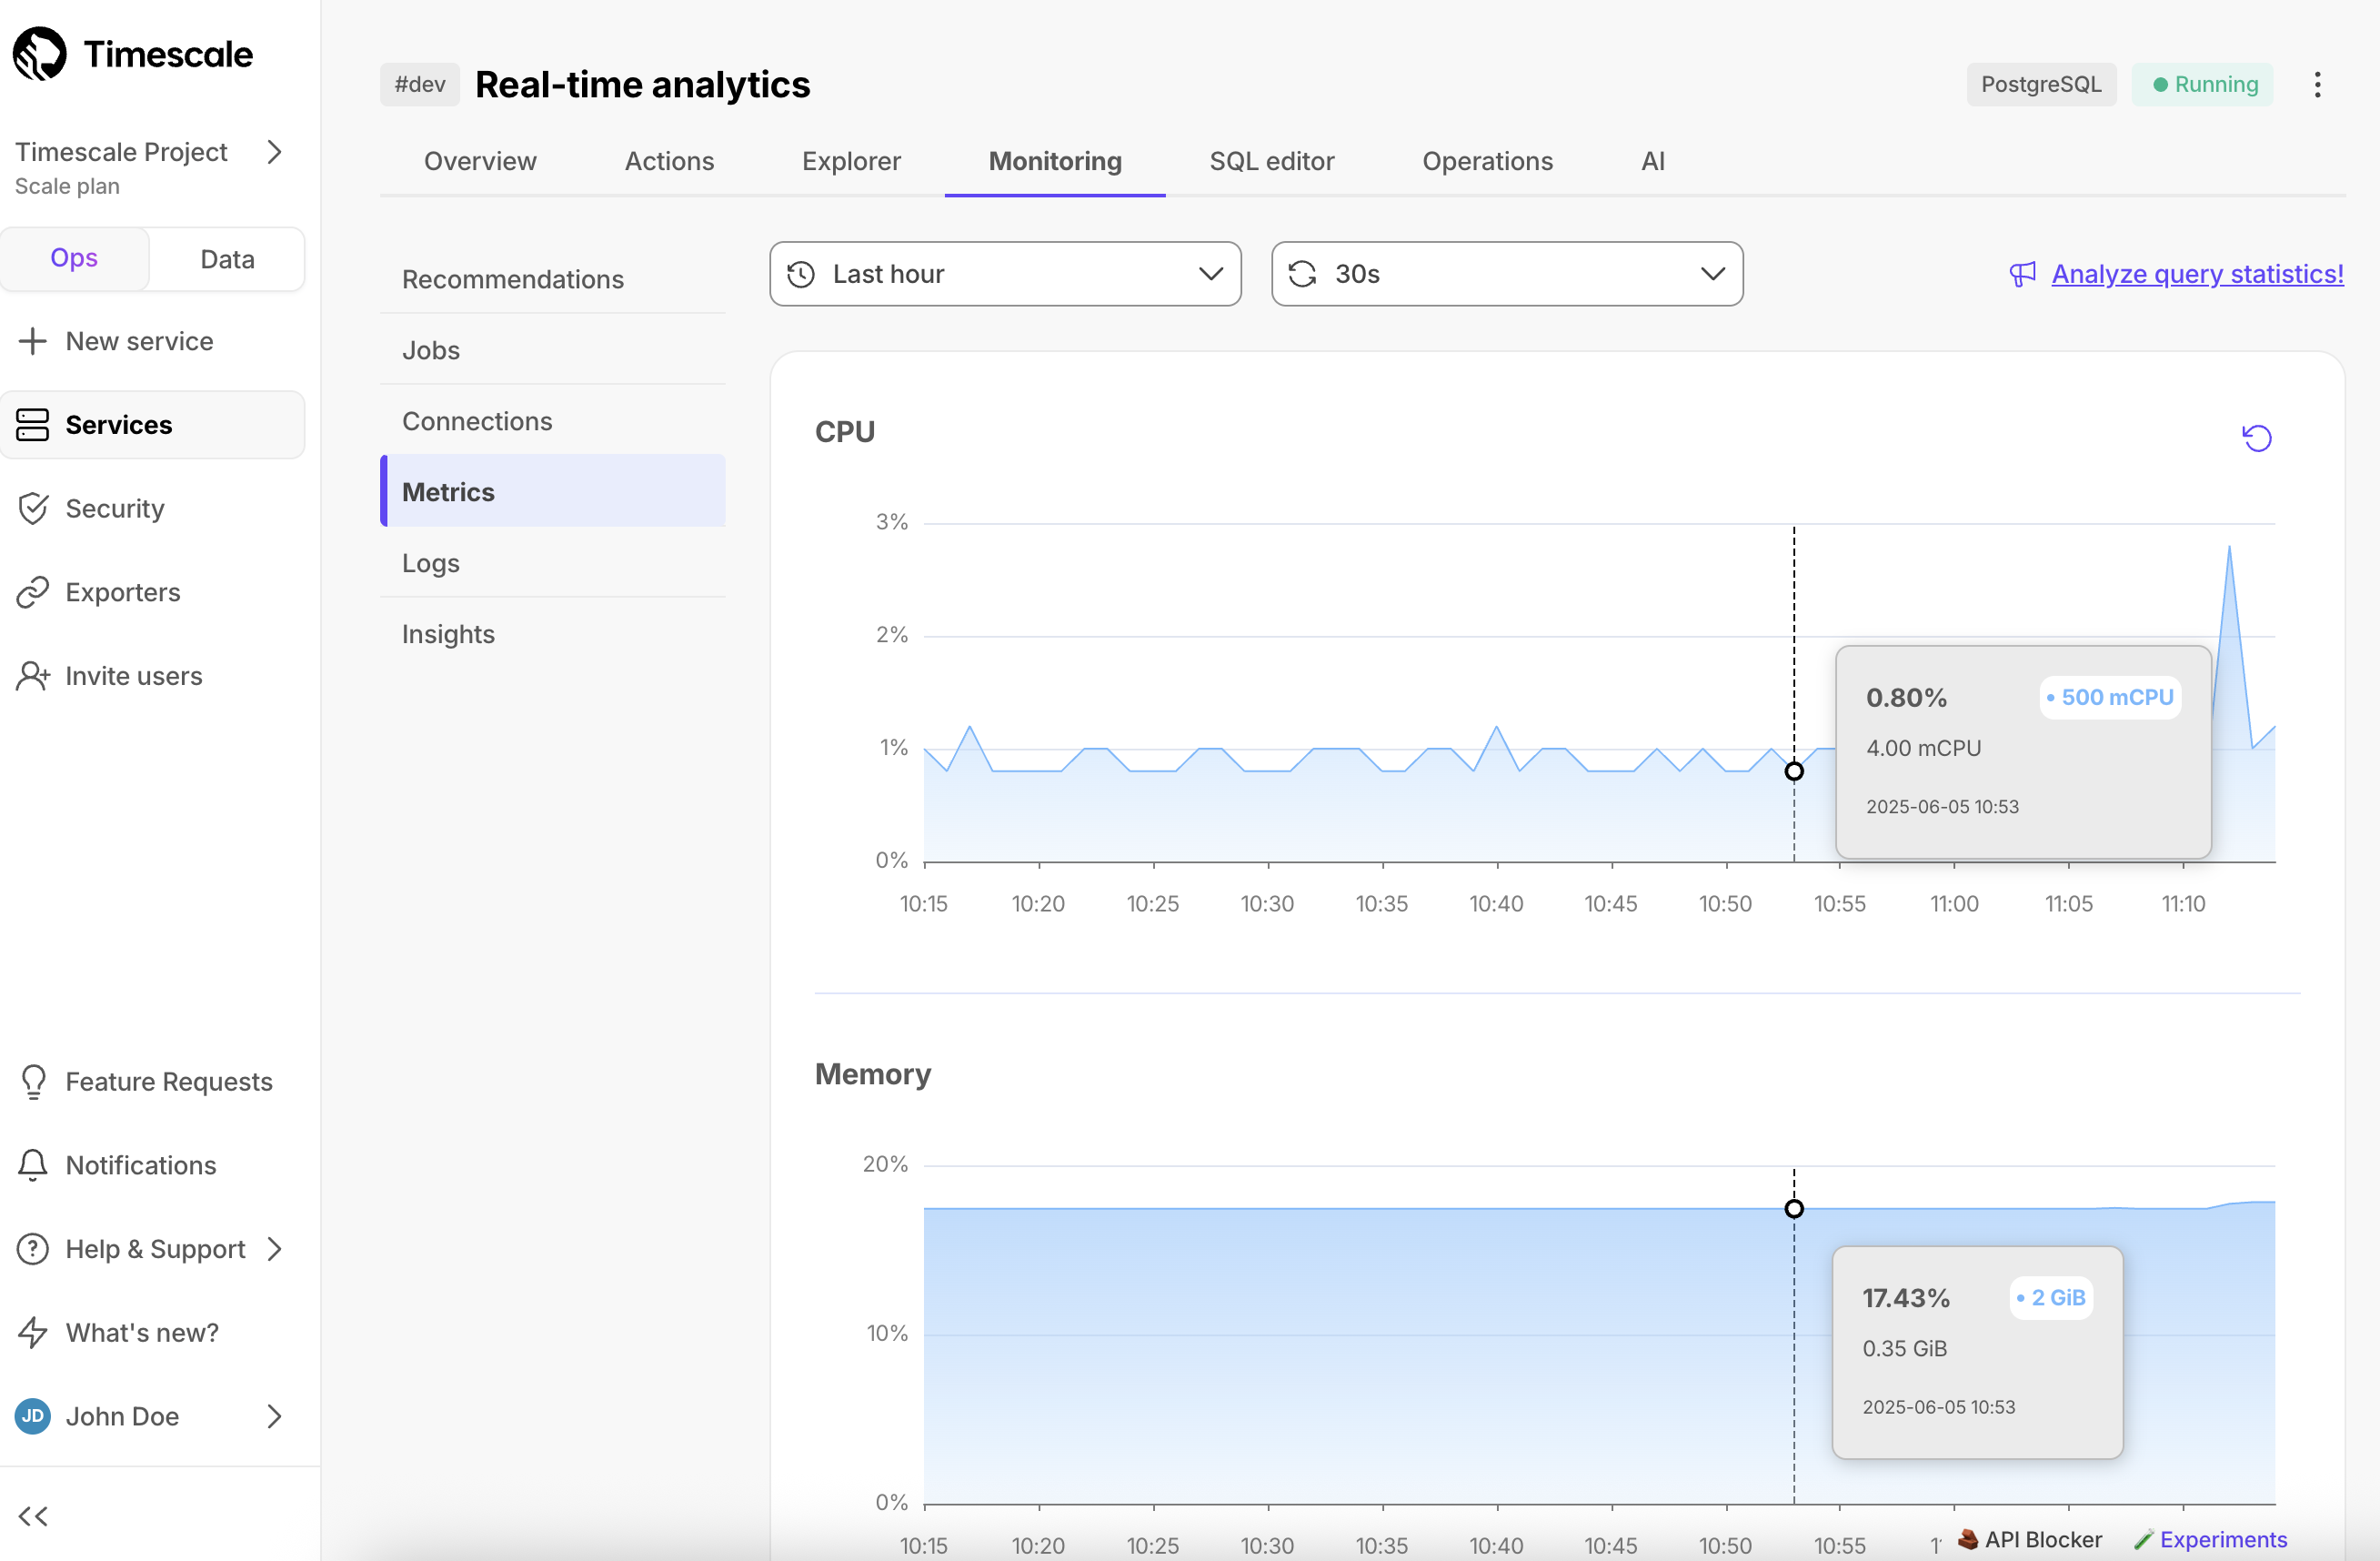
The following metrics are represented by graphs:
- CPU, in mCPU
- Memory, in GiB
- Storage used, in GiB
- Storage IO, in ops/sec
- Storage bandwidth, in MiB/sec
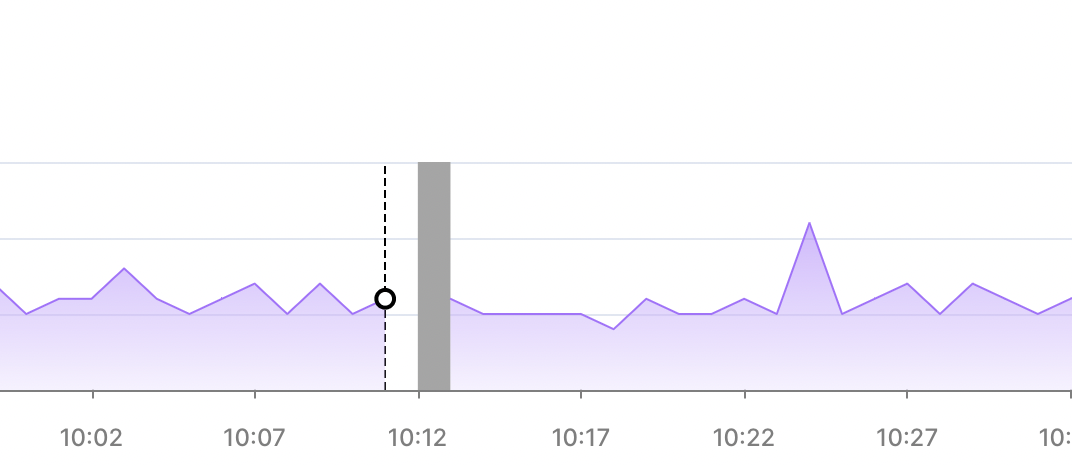
Hover over the graph to view metrics for a specific time point. Select an area in the graph to zoom into a specific period.
Gray bars indicate that metrics have not been collected for the period shown.
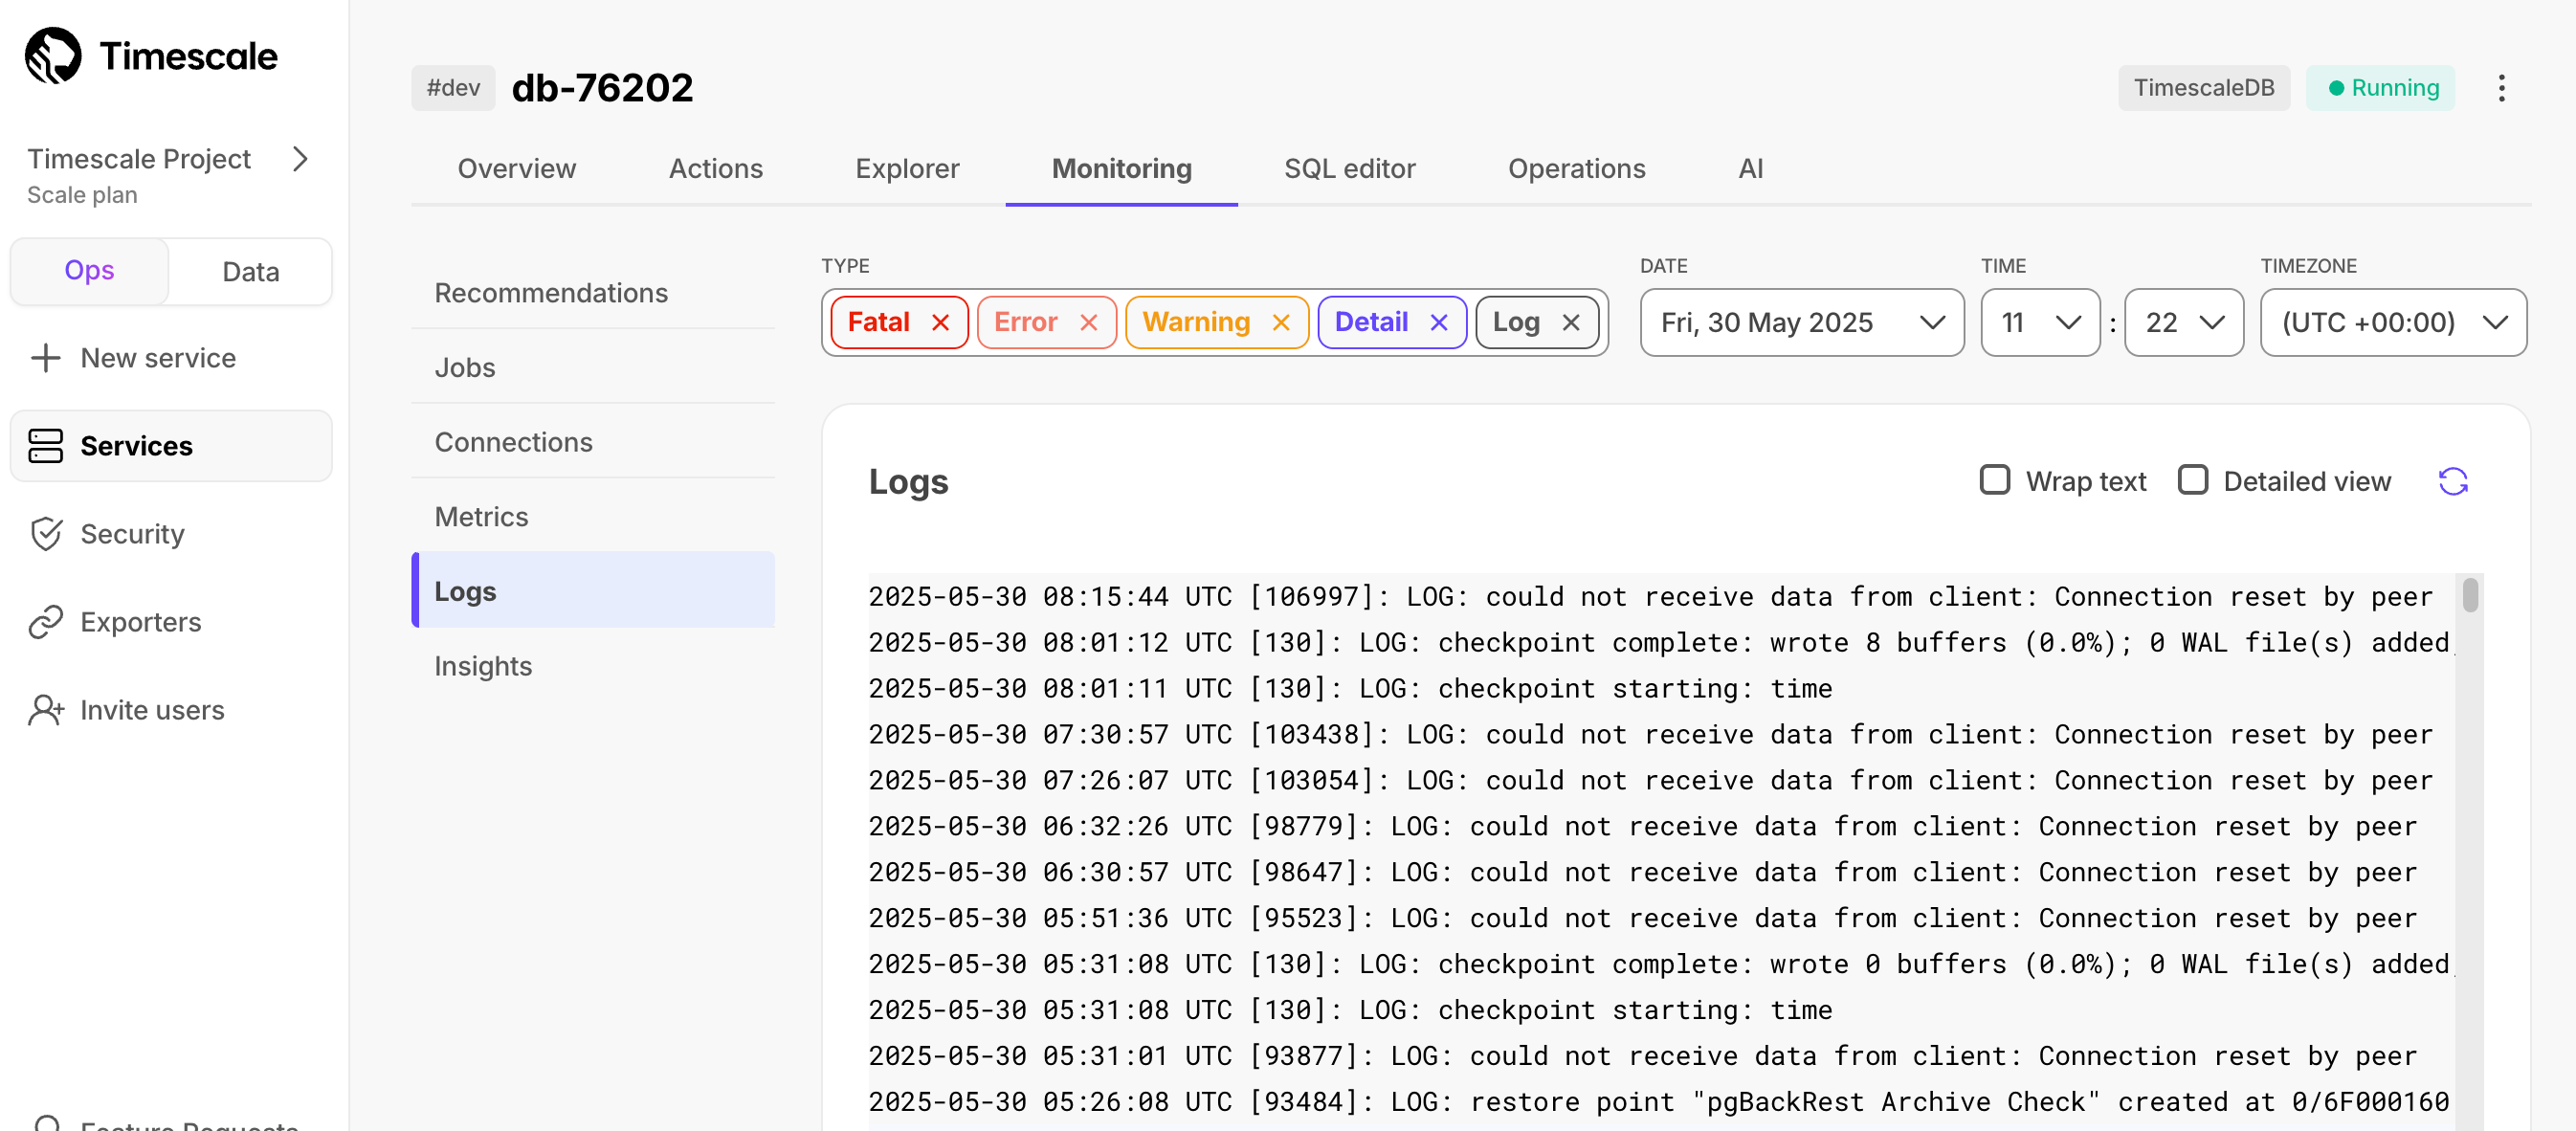
Timescale Cloud shows you detailed logs for your service, which you can filter by type, date, and time.
To access logs, select your service in Timescale Console, then click Monitoring > Logs:
Insights help you get a comprehensive understanding of how your queries perform over time, and make the most efficient use of your resources.
To view insights, select your service, then click Monitoring > Insights. Search or filter queries by type, maximum execution time, and time frame.
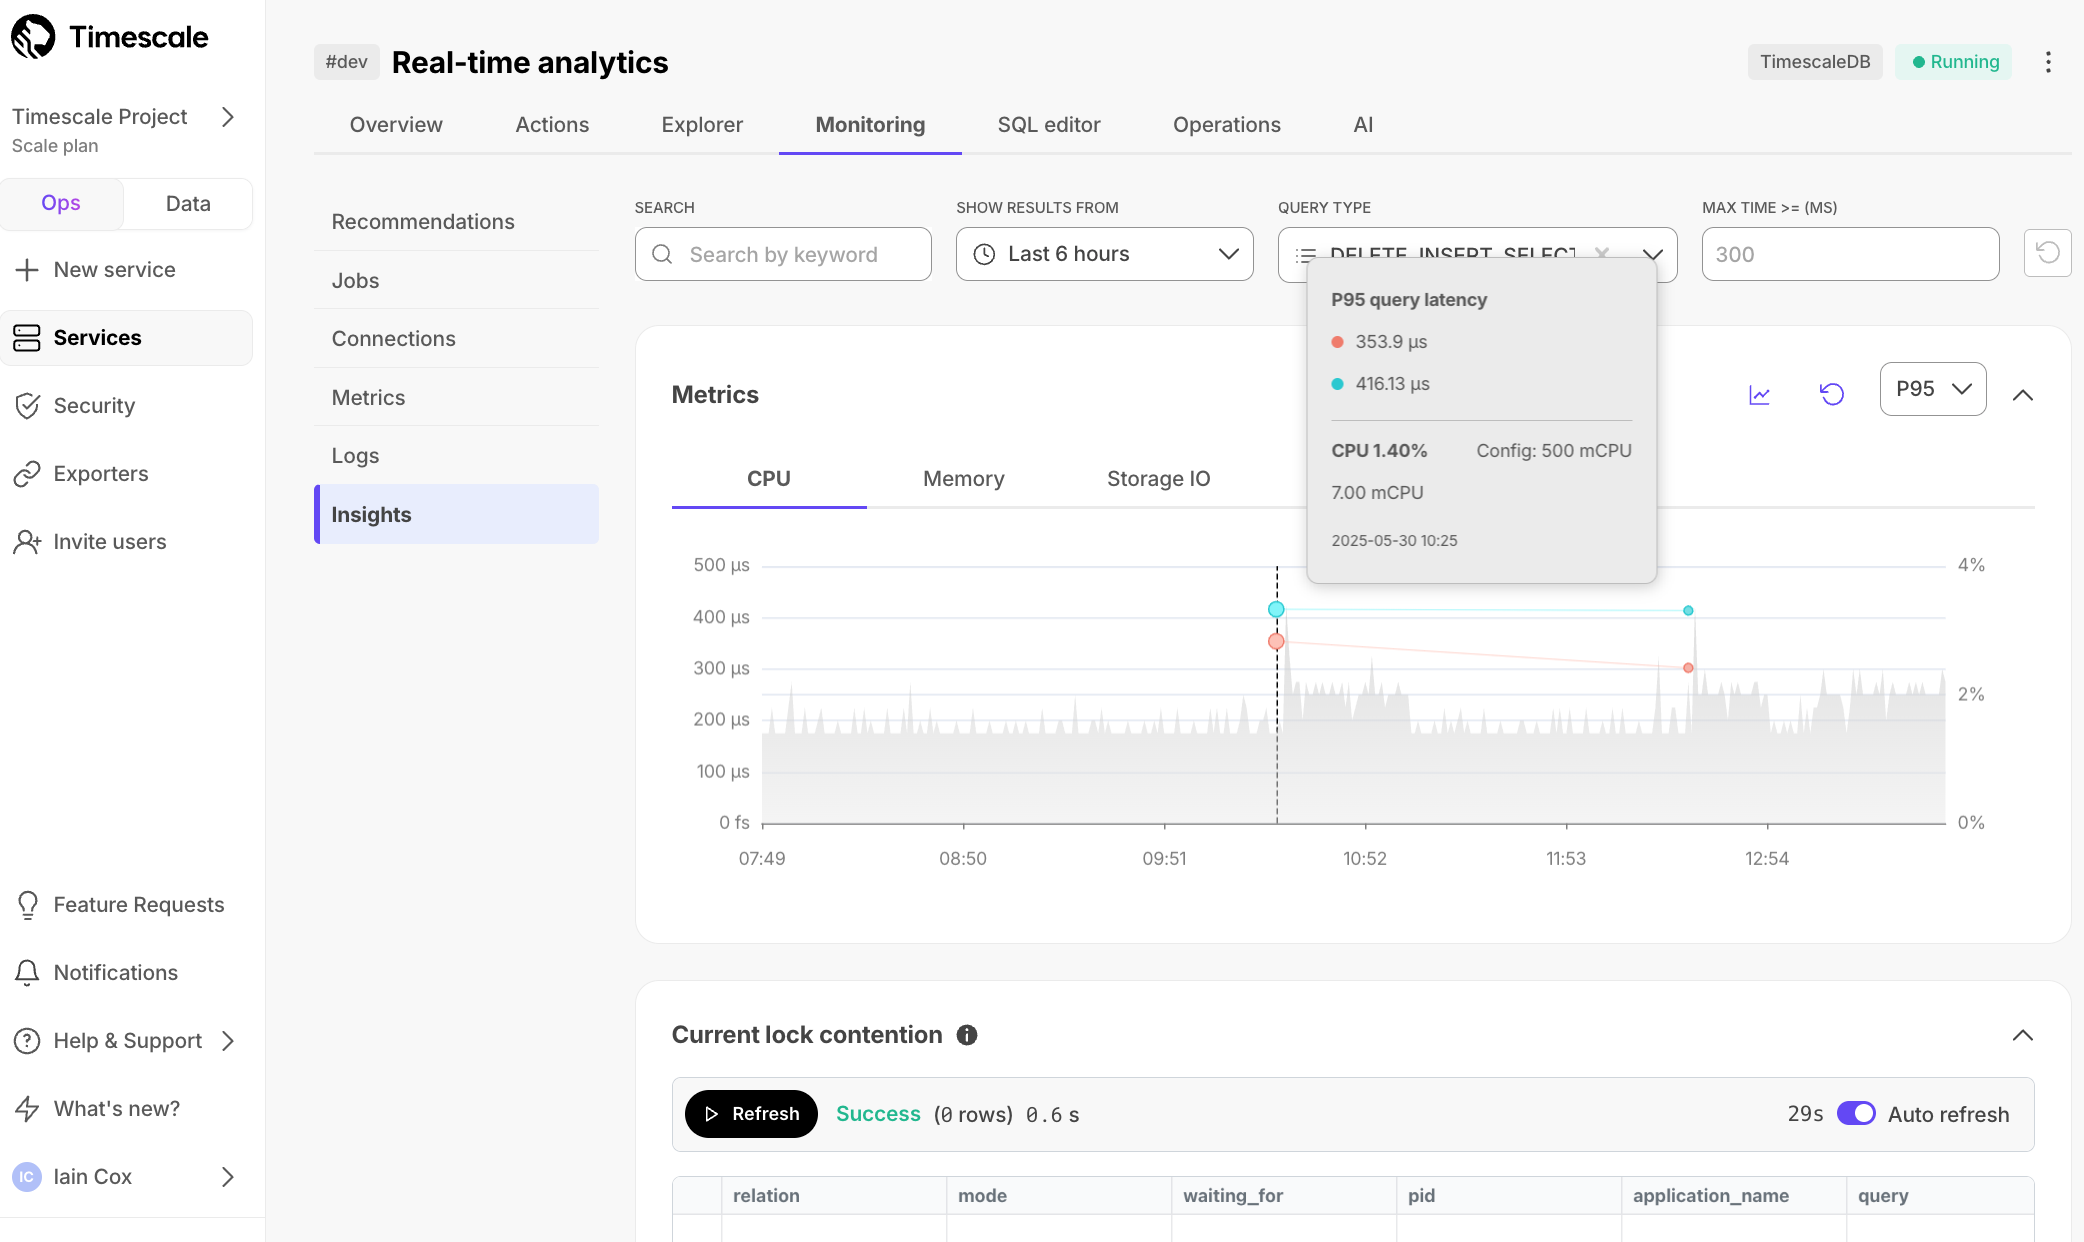
Insights include Metrics, Current lock contention, and Queries.
Metrics provides a visual representation of CPU, memory, and storage input/output usage over time. It also overlays the execution times of the top three queries matching your search. This helps correlate query executions with resource utilization. Select an area of the graph to zoom into a specific time frame.
Current lock contention shows how many queries or transactions are currently waiting for locks held by other queries or transactions.
Queries displays the top 50 queries matching your search. This includes executions, total rows, total time, median time, P95 time, related hypertables, tables in the columnstore, and user name.
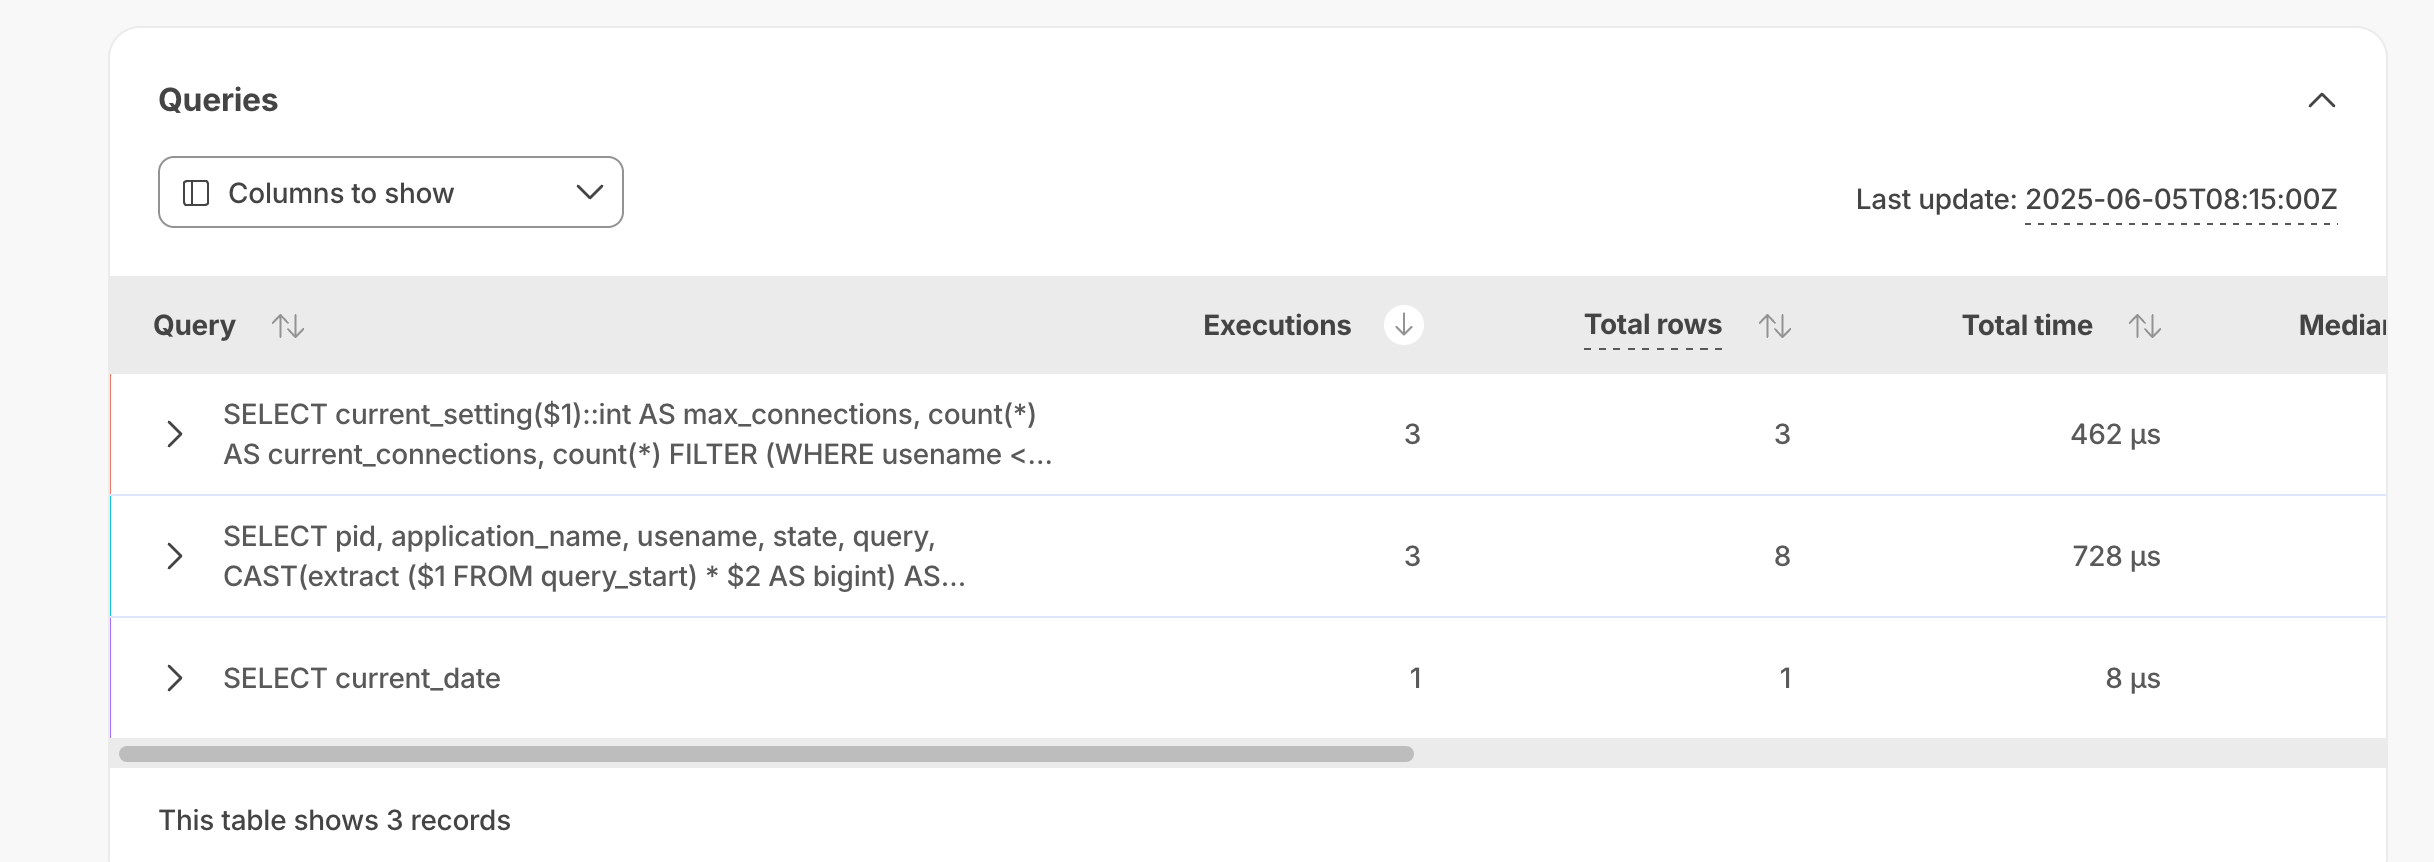
| Column | Description |
|---|---|
Executions | The number of times the query ran during the selected period. |
Total rows | The total number of rows scanned, inserted, or updated by the query during the selected period. |
Total time | The total time of query execution. |
Median time | The median (P50) time of query execution. |
P95 time | The ninety-fifth percentile, or the maximum time of query execution. |
Hypertables | If the query ran on a hypertable. |
Columnar tables | If the query drew results from a chunk in the columnstore. |
User name | The user name of the user running the query. |
These metrics calculations are based on the entire period you've selected. For example, if you've selected six hours, all the metrics represent an aggregation of the previous six hours of executions.

Note
If you have just completed a query, it can take some minutes for it to show in the table. Wait a little, then refresh the page to see your query. Check out the last update value at the top of the query table to identify the timestamp from the last processed query stat.
Click a query in the list to see the drill-down view. This view not only helps you identify spikes and unexpected behaviors, but also offers information to optimize your query.
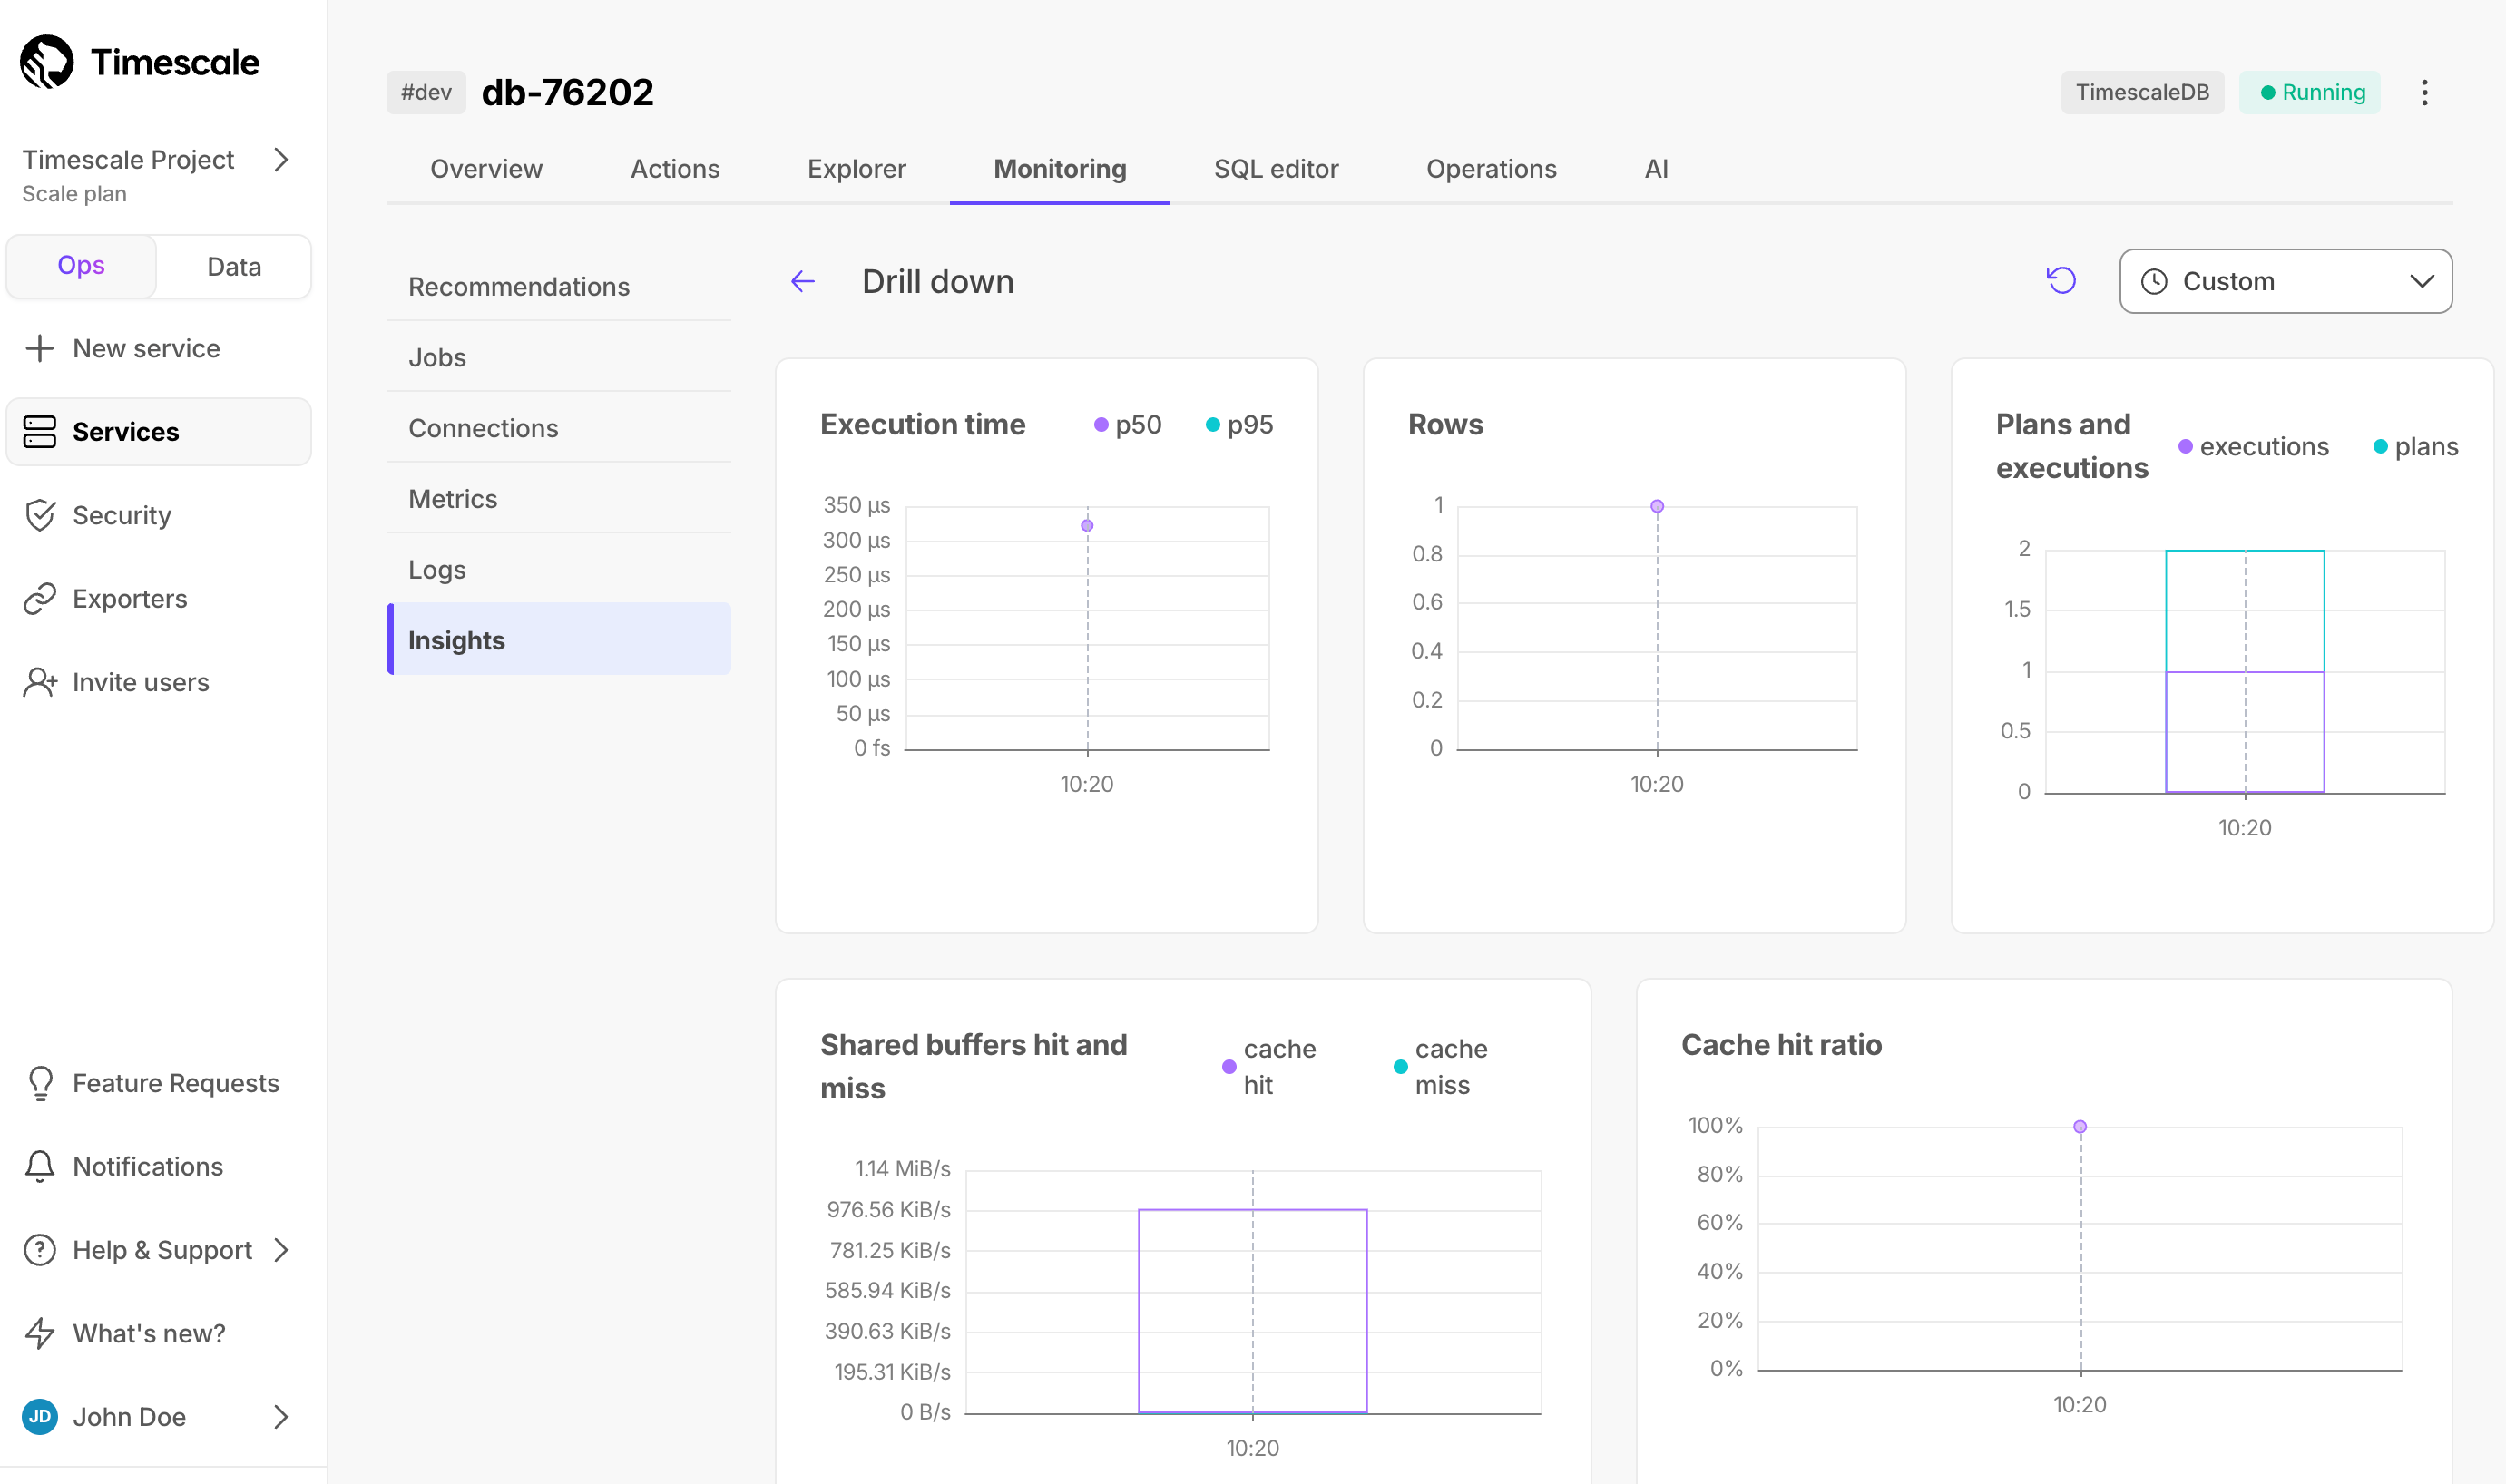
This view includes the following graphs:
Execution time: the median and P95 query execution times over the selected period. This is useful to understand the consistency and efficiency of your query's execution over time.Rows: the impact of your query on rows over time. If it's aSELECTstatement, it shows the number of rows retrieved, while for anINSERT/UPDATEstatement, it reflects the rows inserted.Plans and executions: the number of query plans and executions over time. You can use this to optimize query performance, helping you assess if you can benefit from prepared statements to reduce planning overhead.Shared buffers hit and miss: shared buffers play a critical role in PostgreSQL's performance by caching data in memory. A shared buffer hit occurs when the required data block is found in the shared buffer memory, while a miss indicates that PostgreSQL couldn't locate the block in memory. A miss doesn't necessarily mean a disk read, because PostgreSQL may retrieve the data from the operating system's disk pages cache. If you observe a high number of shared buffer misses, your current shared buffers setting might be insufficient. Increasing the shared buffer size can improve cache hit rates and query speed.Cache hit ratio: measures how much of your query's data is read from shared buffers. A 100% value indicates that all the data required by the query was found in the shared buffer, while a 0% value means none of the necessary data blocks were in the shared buffers. This metric provides a clear understanding of how efficiently your query leverages shared buffers, helping you optimize data access and database performance.
Timescale Cloud: Performance, Scale, Enterprise
Self-hosted products
MST
You can also get query-level statistics for your services with the pg_stat_statements extension. This includes the time spent planning and executing each query; the number of blocks hit, read, and written; and more. pg_stat_statements comes pre-installed with Timescale Cloud.
Note
For more information about pg_stat_statements, see the PostgreSQL documentation![]() .
.
Query the pg_stat_statements view as you would any PostgreSQL view.
The full view includes superuser queries used by Timescale Cloud to manage your service in the background. To view only your
queries, filter by the current user.
Connect to your service and run the following command:
SELECT * FROM pg_stat_statements WHERE pg_get_userbyid(userid) = current_user;
For example, to identify the top five longest-running queries by their mean execution time:
SELECT calls,mean_exec_time,queryFROM pg_stat_statementsWHERE pg_get_userbyid(userid) = current_userORDER BY mean_exec_time DESCLIMIT 5;
Or the top five queries with the highest relative variability in the execution time, expressed as a percentage:
SELECT calls,stddev_exec_time/mean_exec_time*100 AS rel_std_dev,queryFROM pg_stat_statementsWHERE pg_get_userbyid(userid) = current_userORDER BY rel_std_dev DESCLIMIT 5;
For more examples and detailed explanations, see the blog post on identifying
performance bottlenecks with pg_stat_statements![]() .
.
Keywords
Found an issue on this page?Report an issue![]() or Edit this page
or Edit this page![]() in GitHub.
in GitHub.