Timescale Cloud: Performance, Scale, Enterprise
Self-hosted products
MST
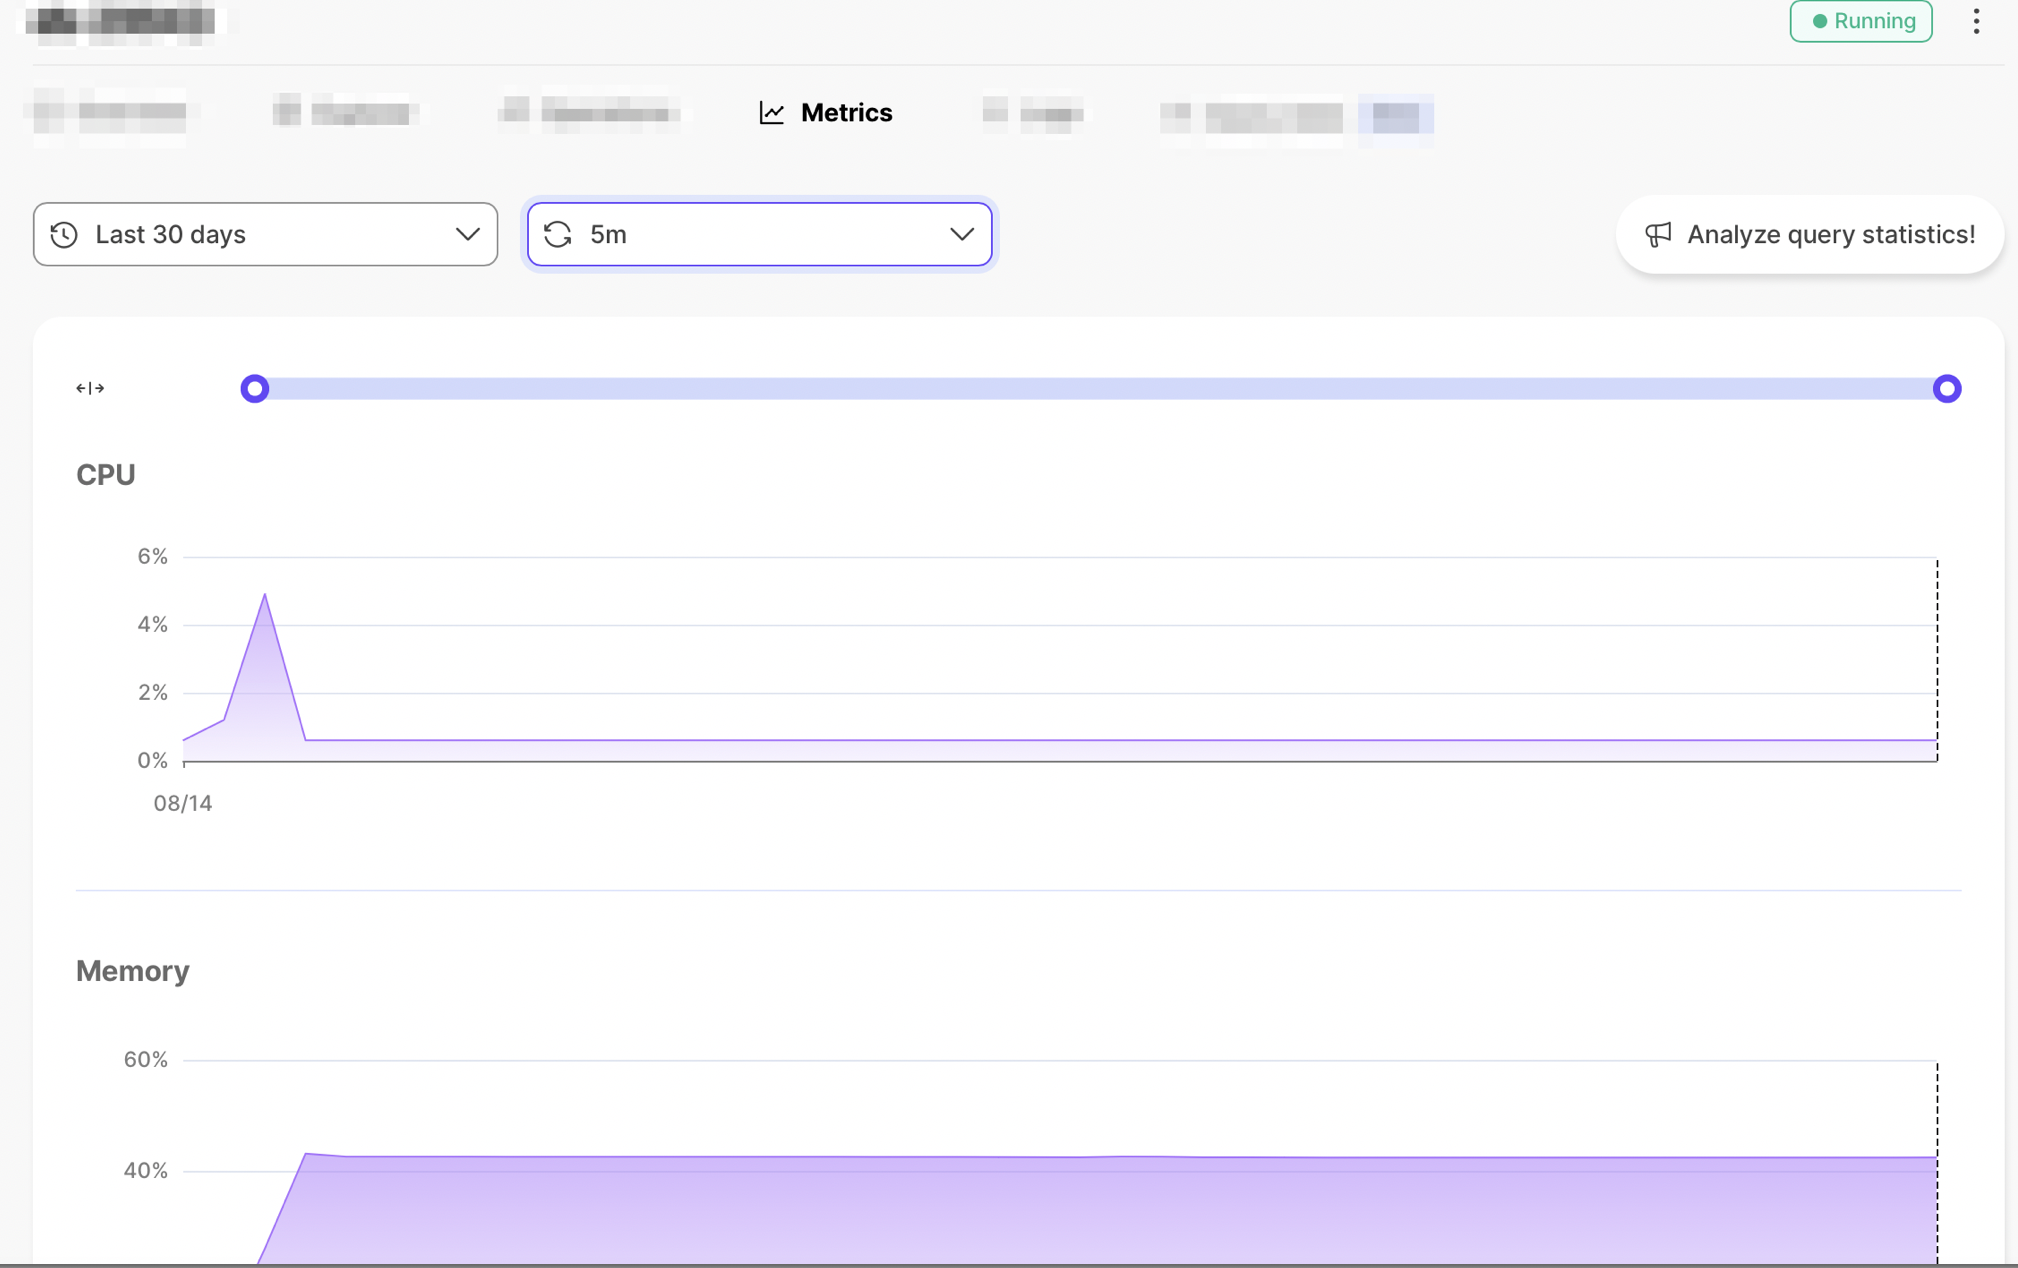
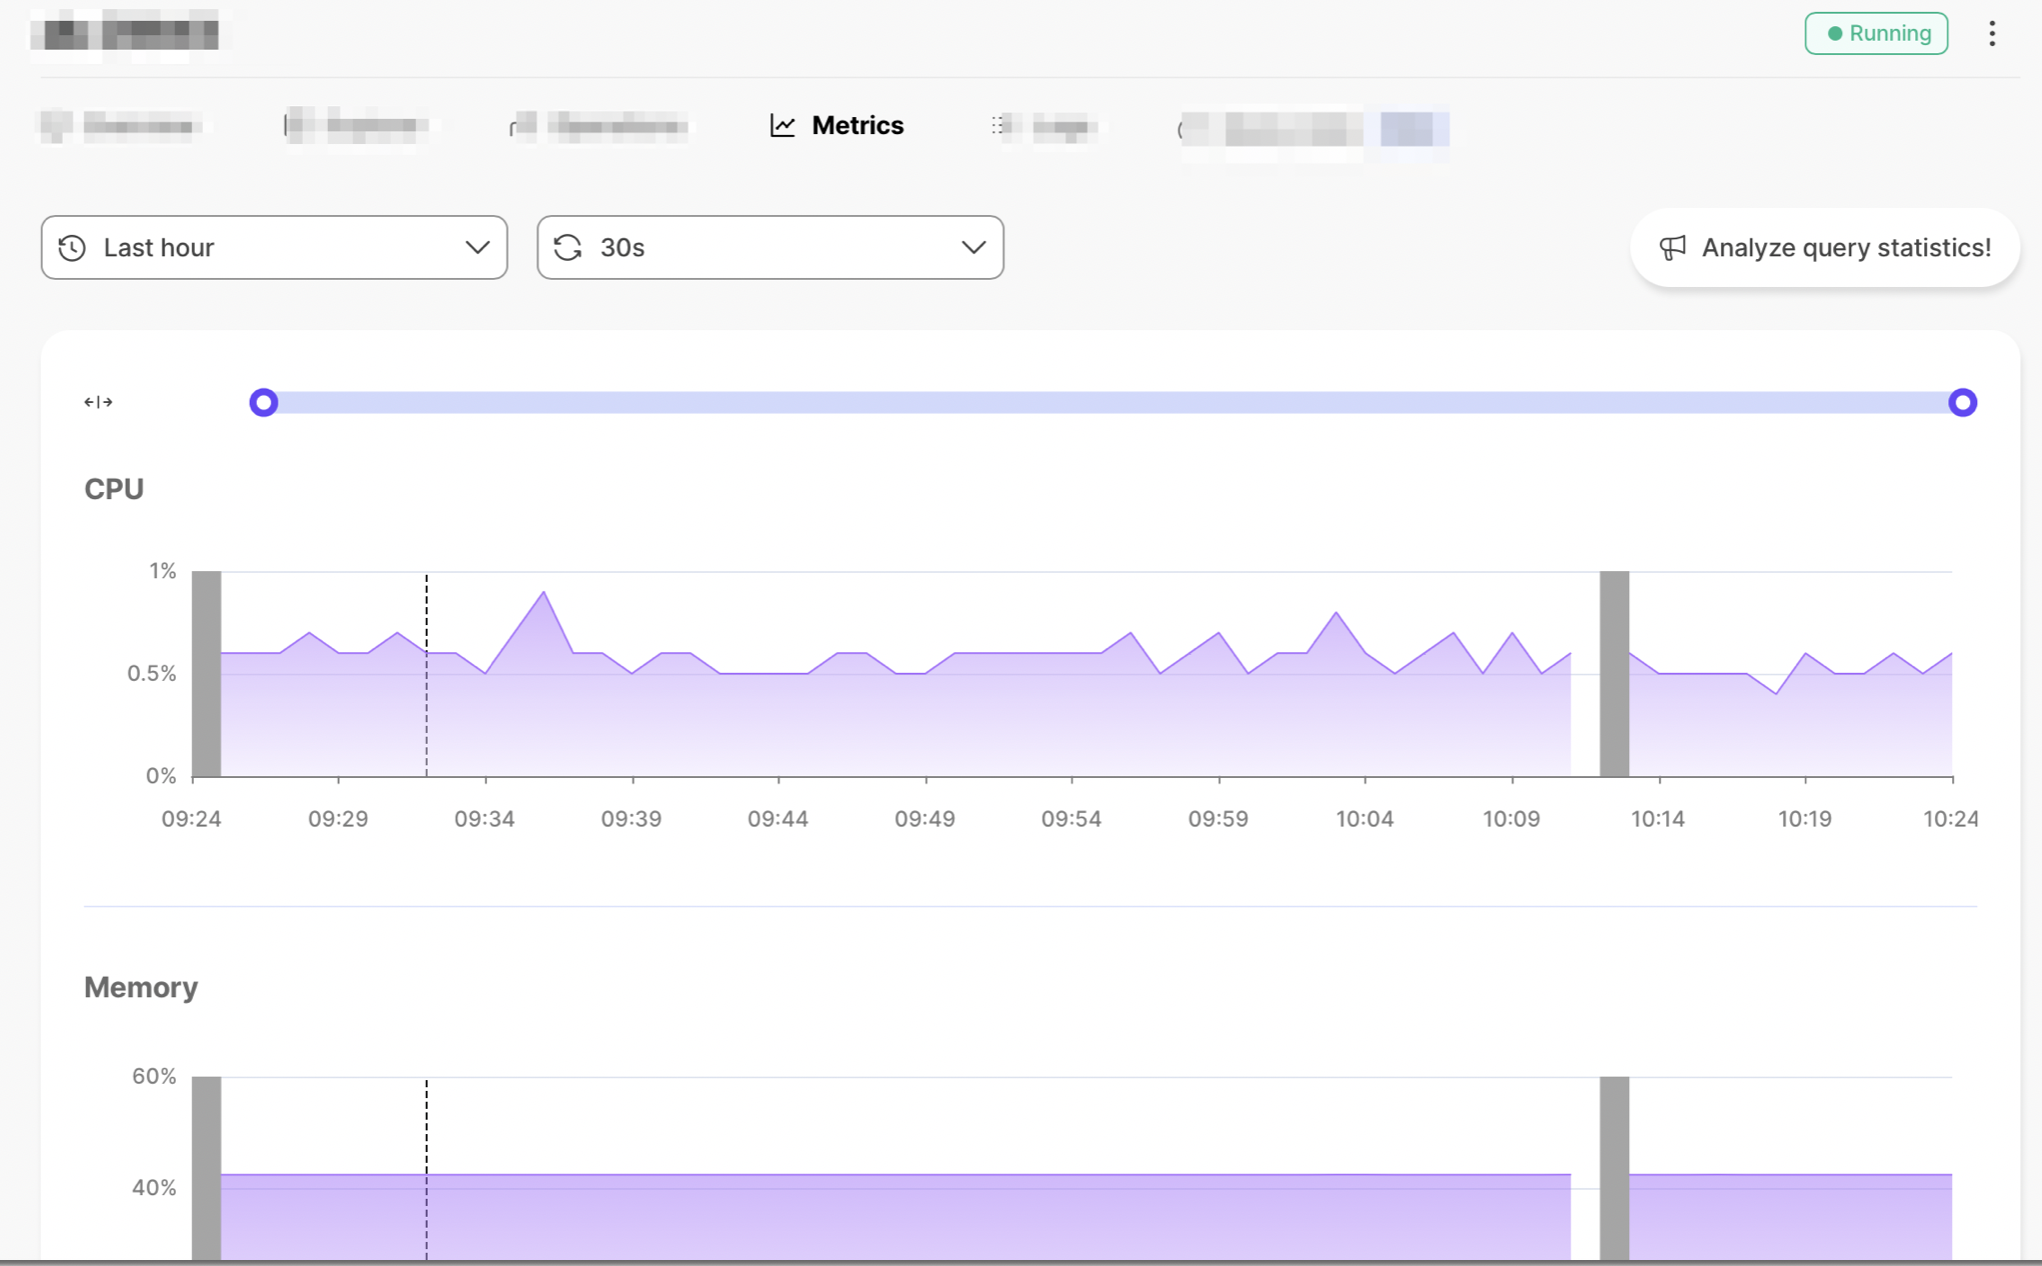
You can view your service metrics from the Timescale metrics dashboard. This dashboard gives you service-level information, such as CPU, memory, and storage usage.
You can view your query-level statistics by using the pre-installed
pg_stat_statements extension from a PostgreSQL client.
Timescale provides a metrics dashboard for managing your services. You can
see the Metrics dashboard in your Timescale account by navigating to the
Services section, clicking the service you want to explore, and selecting the
Metrics tab.
You can view metrics for your services for any of these time ranges:
- Last hour, with one minute granularity
- Last 24 hours, with one minute granularity
- Last seven days, with one hour granularity
- Last 30 days, with one hour granularity
To change the view, select the time range from the drop-down menu.

Additionally, you can turn automatic metric refreshes on and off. When automatic metric refresh is on, the dashboard updates every thirty seconds.
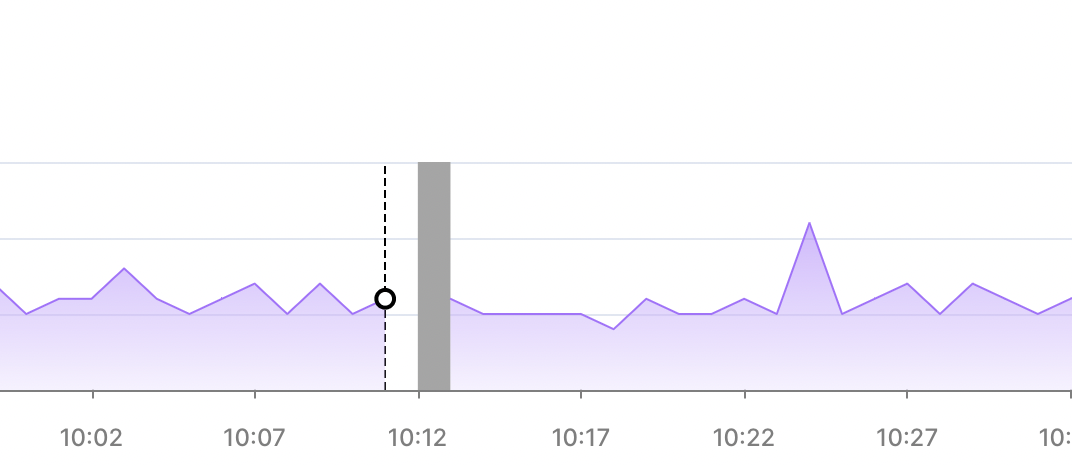
In some cases, gray vertical bars display on the metrics dashboard, like this:

This indicates that metrics have not been collected for the period shown. It does not mean that your Timescale service was down.
Timescale continuously monitors the health and resource consumption of all
database services. You can check your health data by navigating to the metrics
tab in your service dashboard. These metrics are also monitored by the Timescale
operations team.

The pg_stat_statements extension gives you query-level statistics for your SQL
statements. It comes pre-installed with Timescale.
Note
For more information about pg_stat_statements, see the PostgreSQL documentation.
You can view statistics for your queries through the pg_stat_statements
extension, which provides a pg_stat_statements view. The recorded statistics
include the time spent planning and executing each query; the number of blocks
hit, read, and written; and more.
You can query the pg_stat_statements view as you would any PostgreSQL view.
The full view includes superuser queries, which are used by Timescale to
manage your service in the background. To view only your
queries, filter by the current user.
Connect to your database using a PostgreSQL client, such as psql, and
run:
SELECT * FROM pg_stat_statements WHERE pg_get_userbyid(userid) = current_user;
With pg_stat_statements, you can view performance statistics that help you
monitor and optimize your queries.
Here are some sample scenarios to try.
Identify the 5 longest-running queries by their mean execution time:
SELECT calls,mean_exec_time,queryFROM pg_stat_statementsWHERE pg_get_userbyid(userid) = current_userORDER BY mean_exec_time DESCLIMIT 5;
Identifying queries with highly variable execution time:
The relative standard deviation, or the standard deviation expressed as a percentage of the mean, measures how variable the execution time is. The higher the relative standard deviation, the more variable the query execution time.
SELECT calls,stddev_exec_time/mean_exec_time*100 AS rel_std_dev,queryFROM pg_stat_statementsWHERE pg_get_userbyid(userid) = current_userORDER BY rel_std_dev DESCLIMIT 5;
For more examples and detailed explanations, see the blog post on identifying
performance bottlenecks with pg_stat_statements.
Keywords
Found an issue on this page?Report an issue or Edit this page
in GitHub.